
Advanced Search for Maps
Showing 751-760 of 2217
Official, Map sheet or poster
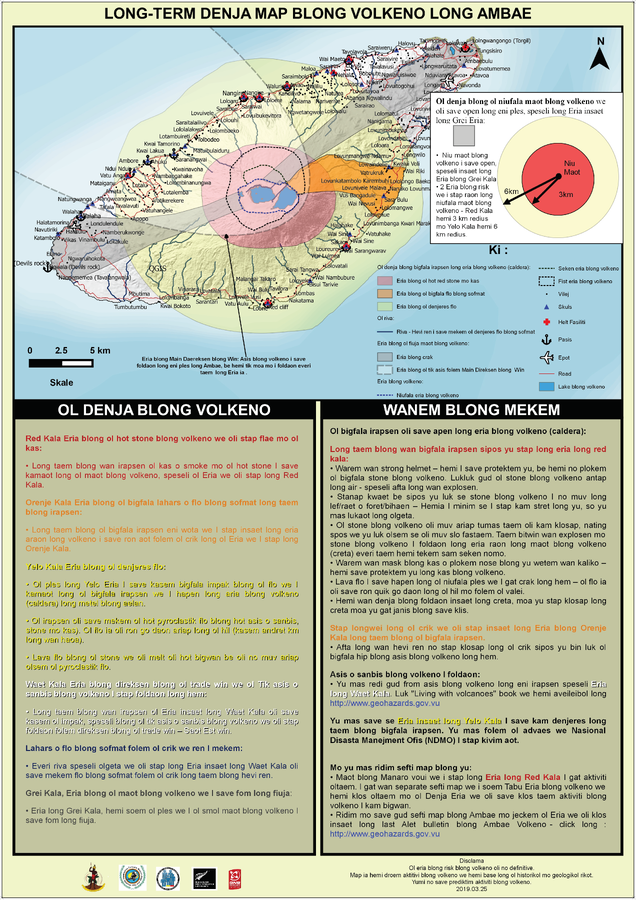
Long-Term Denja Map Blong Volkeno Long Ambae
(Ambae Long-Term Background Volcanic Hazards Map)
Vanuatu Meteorology & Geo-Hazards Department. (2019). Long-Term Denja Map Blong Volkeno Long Ambae. Government of Vanuatu, Vanuatu Meteorology & Geo-Hazards Department, Vanuatu National Disaster Risk Management Office, New Zealand Foreign Affairs & Trade Aid Programme, GNS Science.
Official, Map sheet or poster
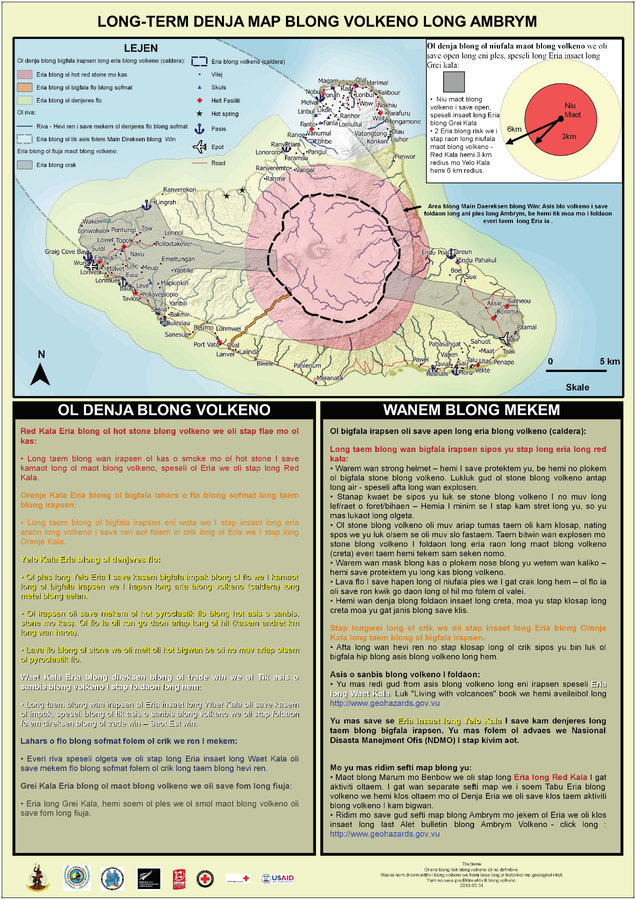
Long-term Denja Map Blong Volkeno Long Ambrym
(Ambrym Long-Term Background Volcanic Hazards Map)
Vanuatu Meteorology & Geo-Hazards Department. (2016). Long-term Denja Map Blong Volkeno Long Ambrym. Government of Vanuatu, Vanuatu Meteorology & Geo-Hazards Department, Vanuatu National Disaster Risk Management Office, New Zealand Foreign Affairs & Trade Aid Programme, GNS Science, The Vanuatu Red Cross Society, Croix Rouge Francaise, USAID.
Official, Map sheet or poster
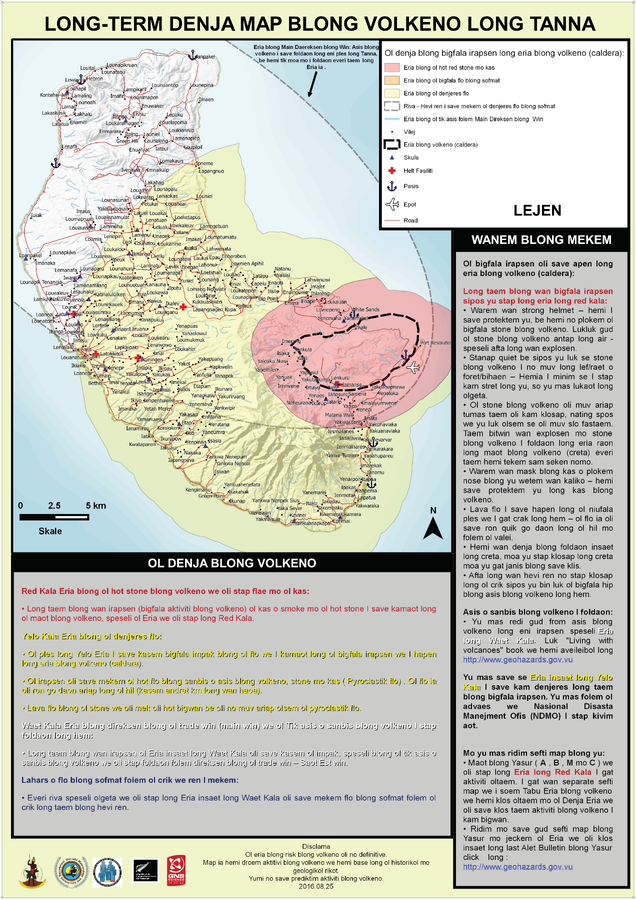
Long-Term Denja Map Blong Volkeno Long Tanna
(Tanna Long-Term Background Volcanic Hazards Map)
Vanuatu Meteorology & Geo-Hazards Department. (2016). Long-Term Denja Map Blong Volkeno Long Tanna. Government of Vanuatu, Vanuatu Meteorology & Geo-Hazards Department, Vanuatu National Disaster Risk Management Office, New Zealand Foreign Affairs & Trade Aid Programme, GNS Science.
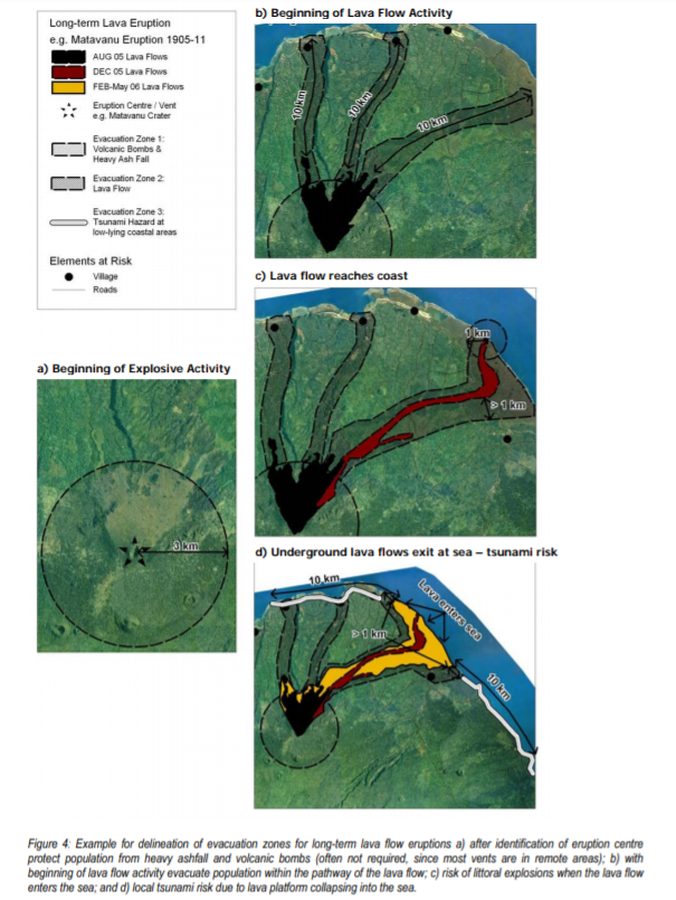
Official, Figure in hazard assessment
Long-term Lava Eruption e.g. Matavanu Eruption 1905-11
Figure 4 in: Cronin, S., Bonte-Grapentin, M. & Nemeth, K. (2006). Samoa technical report - Review of volcanic hazard maps for Savai'i and Upolu. Pacific Islands Applied Geoscience Commission (SOPAC) Project Report 59.
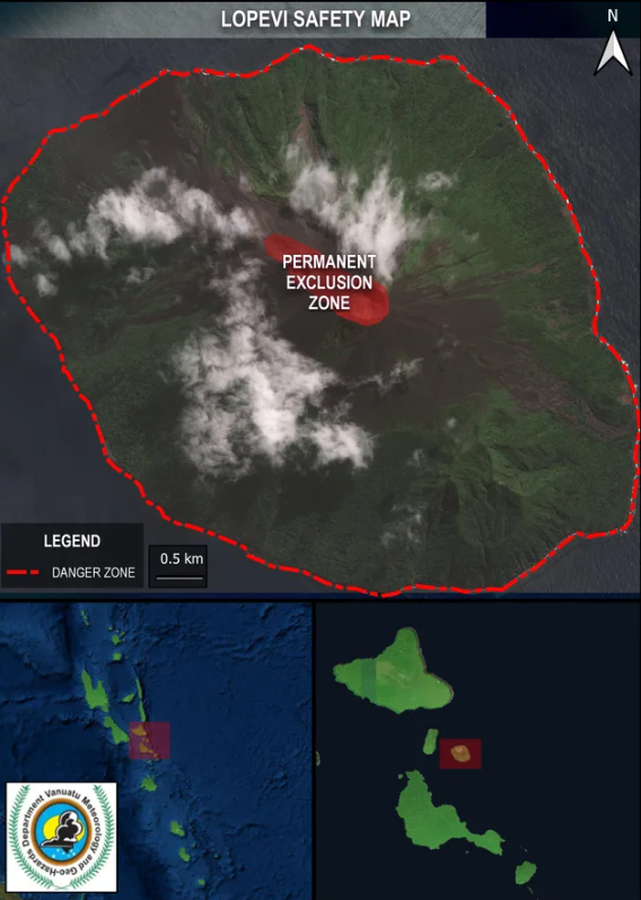
Official, Map in an information statement
Lopevi Safety Map
Vanuatu Meteorology & Geo-Hazards Department. (2025). Vanuatu Volcano Alert Bulletin n°03 - Lopevi Activity (Thursday March 27th 2025). Government of Vanuatu, Vanuatu Meteorology & Geo-Hazards Department.
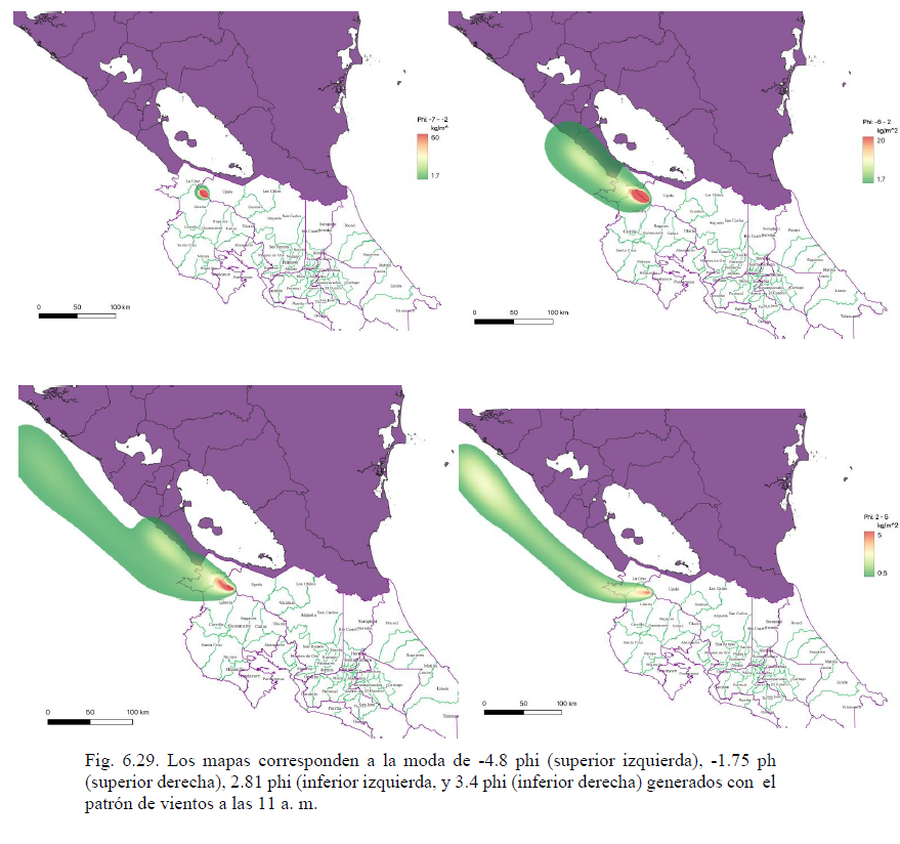
Official, Figure in hazard assessment
Los mapas corresponden a la moda de -4.8 phi (superior izquierda), -1.75 phi (superior derecha) generados con el patrón de vientos a las 11 a.m.
(The maps correspond to the -4.8 phi (top left), -1.75 phi (top right) mode generated with the 11 a.m. wind pattern.)
Figure 6.29 in: Alvarado, G.E., Brenes-André, J., Venegas, L., Alpízar, Y., Núñez, S., Sánchez, M., Abarca, K., Abarca, J., Báez, W.A., Sibaja, J.P., Esquivel, L., & Arcia, T. (2022). Análisis del Peligro Volcánico del Rincón de la Vieja, Costa Rica. Instituto Costarricense de Electricidad (ICE). Setiembre 2022.
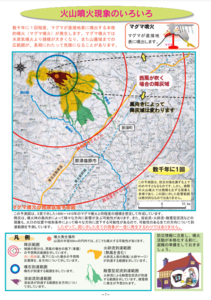
Official, Map in a booklet, long fact-sheet, or handbook
Magma eruption hazard map
Page 7 in: Nasudake Volcano Disaster Prevention Council. (2014). Nasudake Volcano Disaster Prevention Handbook.
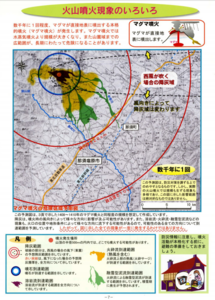
Official, Map in a booklet, long fact-sheet, or handbook
Magma eruption hazard map
Page 7 in: Nasudake Volcano Disaster Prevention Council. (2010). Volcanic disaster prevention handbook of Mt. Nasudake.
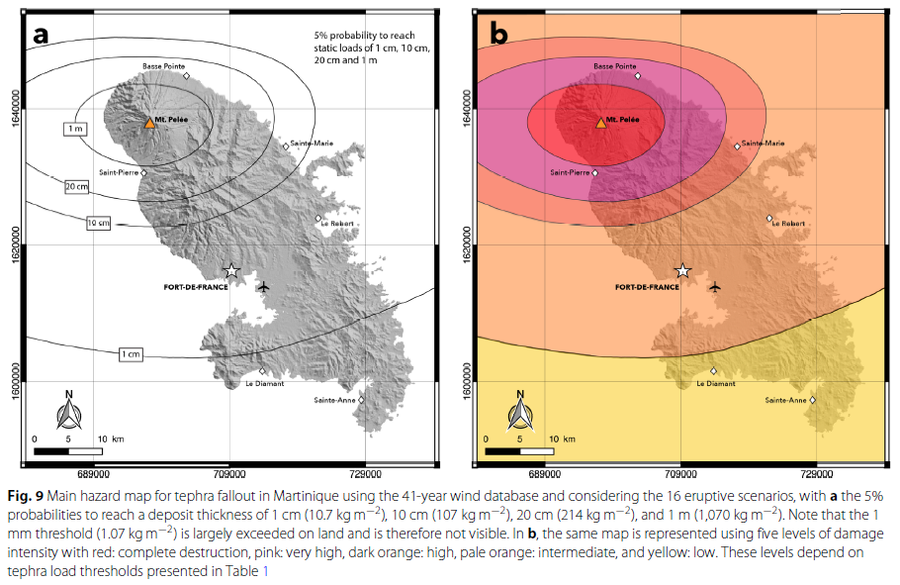
Figure in a journal article
Main hazard map for tephra fallout in Martinique using the 41-year wind database and considering the 16 eruptive scenarios
Figure 9 in: Michaud-Dubuy, A., Carazzo, G., & Kaminski, E. (2021). Volcanic hazard assessment for tephra fallout in Martinique. Journal of Applied Volcanology, 10(1), 1-20. https://doi.org/10.1186/s13617-021-00106-7.
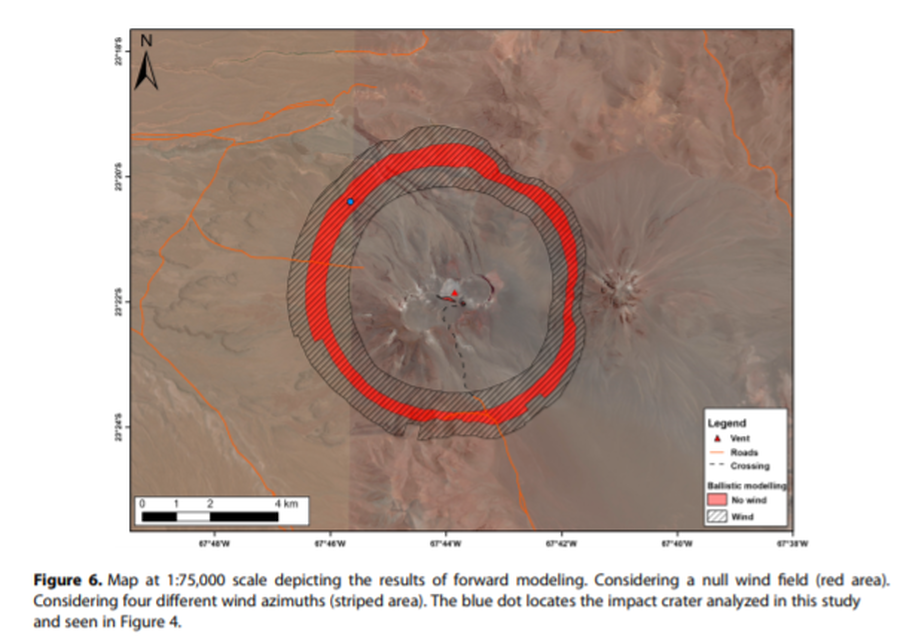
Figure in a journal article
Map at 1:75,000 scale depicting the results of forward modeling
Figure 6 in: Bertin, D. (2017). 3‐D ballistic transport of ellipsoidal volcanic projectiles considering horizontal wind field and variable shape‐dependent drag coefficients. Journal of Geophysical Research: Solid Earth, 122(2), p. 1126-1151. https://doi.org/10.1002/2016JB013320