
Advanced Search for Maps
Showing 811-820 of 2217
Official, Map sheet or poster
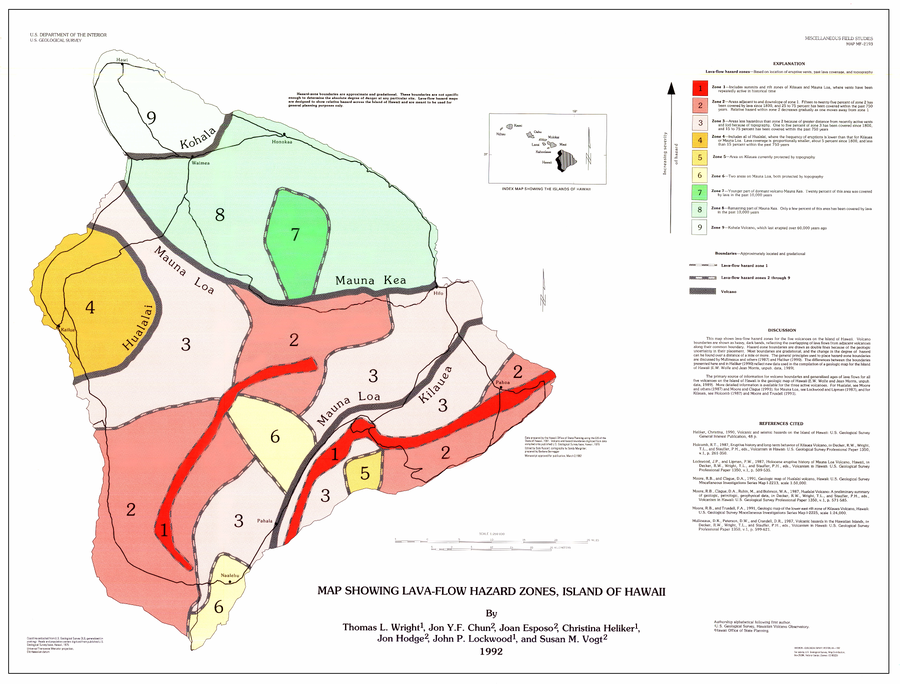
Map Showing Lava-Flow Hazard Zones, Island of Hawaii
Wright, T.L., Chun, J.Y.F., Exposo, J., Heliker, C., Hodge, J., Lockwood, J.P., & Vogt, S.M. (1992). Map showing lava-flow hazard zones, Island of Hawaii. U.S. Geological Survey, Miscellaneous Field Studies Map 2193, scale 1:250,000. https://doi.org/10.3133/mf2193
Official, Figure on website
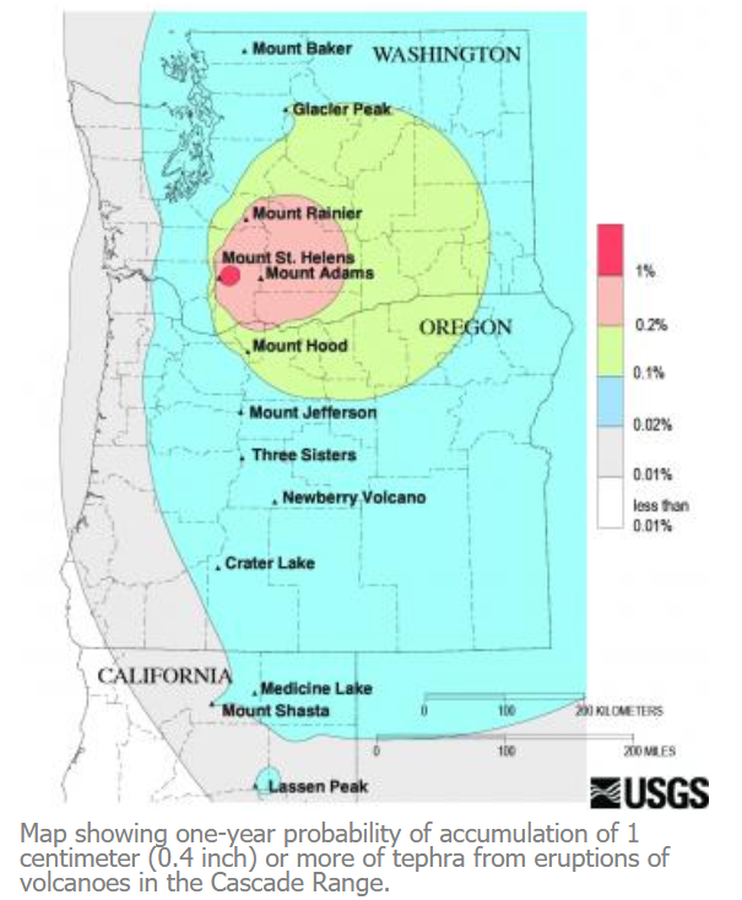
Map showing one-year probability of accumulation of 1 centimeter (0.4 inch) or more of tephra from eruptions of volcanoes in the Cascade Range.
Nathensen, M. (2013). Map showing one-year probability of accumulation of 1 centimeter (0.4 inch) or more of tephra from eruptions of volcanoes in the Cascade Range. U.S. Geological Survey. Mount Bachelor Hazards. https://www.usgs.gov/volcanoes/mount-bachelor/hazards
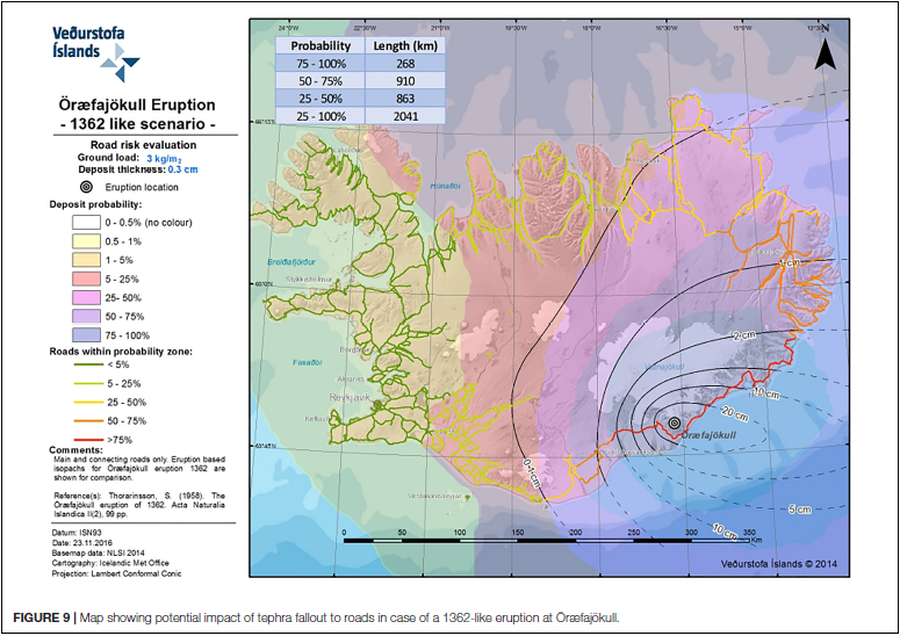
Figure in a journal article
Map showing potential impact of tephra fallout to roads in case of a 1362-like eruption at Öræfajökull
Figure 9 in: Barsotti, S., Di Rienzo, D. I., Thordarson, T., Björnsson, B. B., & Karlsdóttir, S. (2018). Assessing impact to infrastructures due to tephra fallout from Öræfajökull volcano (Iceland) by using a scenario-based approach and a numerical model. Frontiers in Earth Science, 6, 196. https://doi.org/10.3389/feart.2018.00196
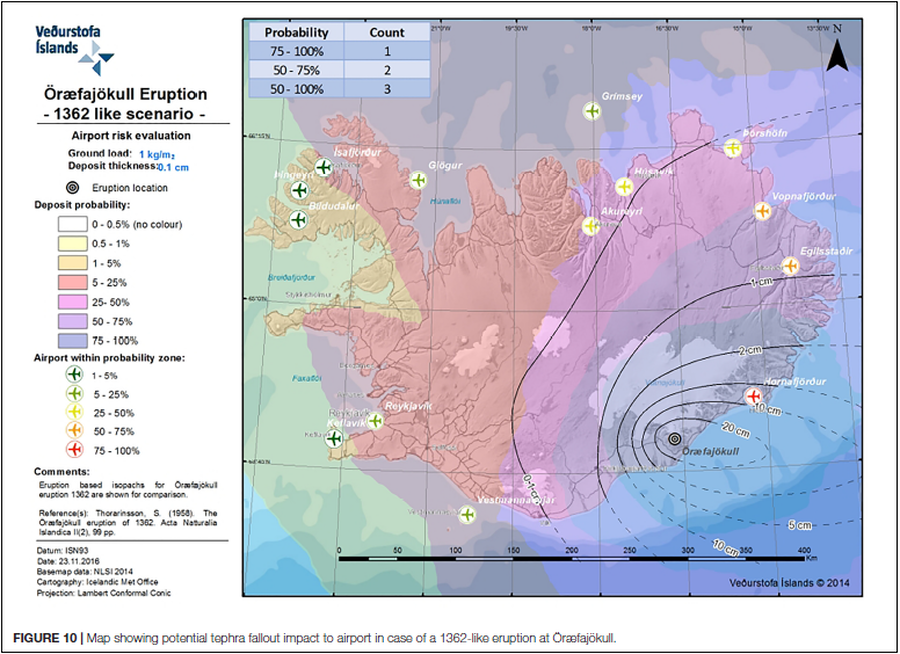
Figure in a journal article
Map showing potential tephra fallout impact to airport in case of a 1362-like eruption at Öræfajökull
Figure 10 in: Barsotti, S., Di Rienzo, D. I., Thordarson, T., Björnsson, B. B., & Karlsdóttir, S. (2018). Assessing impact to infrastructures due to tephra fallout from Öræfajökull volcano (Iceland) by using a scenario-based approach and a numerical model. Frontiers in Earth Science, 6, 196. https://doi.org/10.3389/feart.2018.00196
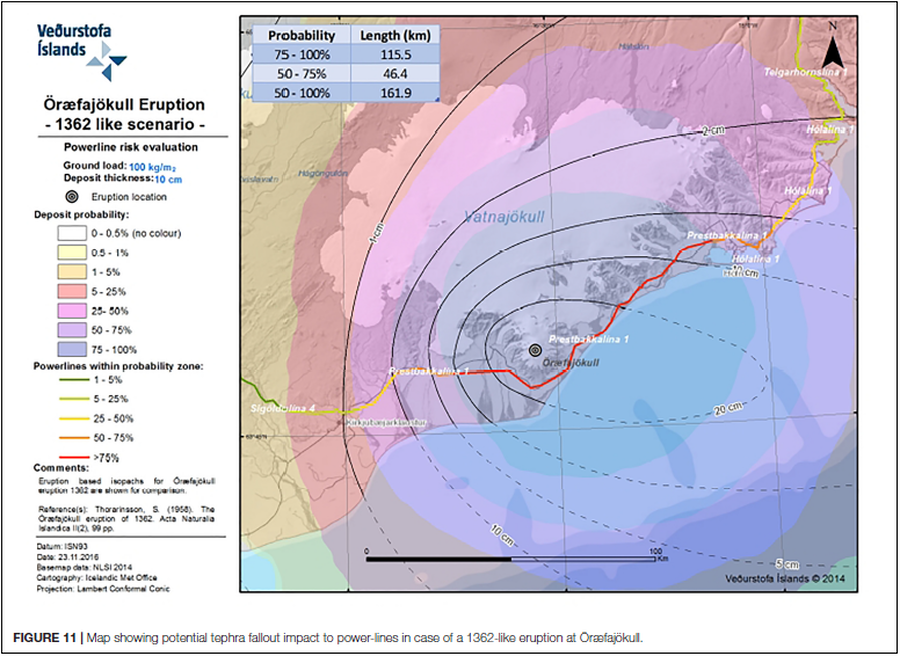
Figure in a journal article
Map showing potential tephra fallout impact to power-lines in case of a 1362-like eruption at Öræfajökull
Figure 11 in: Barsotti, S., Di Rienzo, D. I., Thordarson, T., Björnsson, B. B., & Karlsdóttir, S. (2018). Assessing impact to infrastructures due to tephra fallout from Öræfajökull volcano (Iceland) by using a scenario-based approach and a numerical model. Frontiers in Earth Science, 6, 196. https://doi.org/10.3389/feart.2018.00196
Official, Figure in hazard assessment
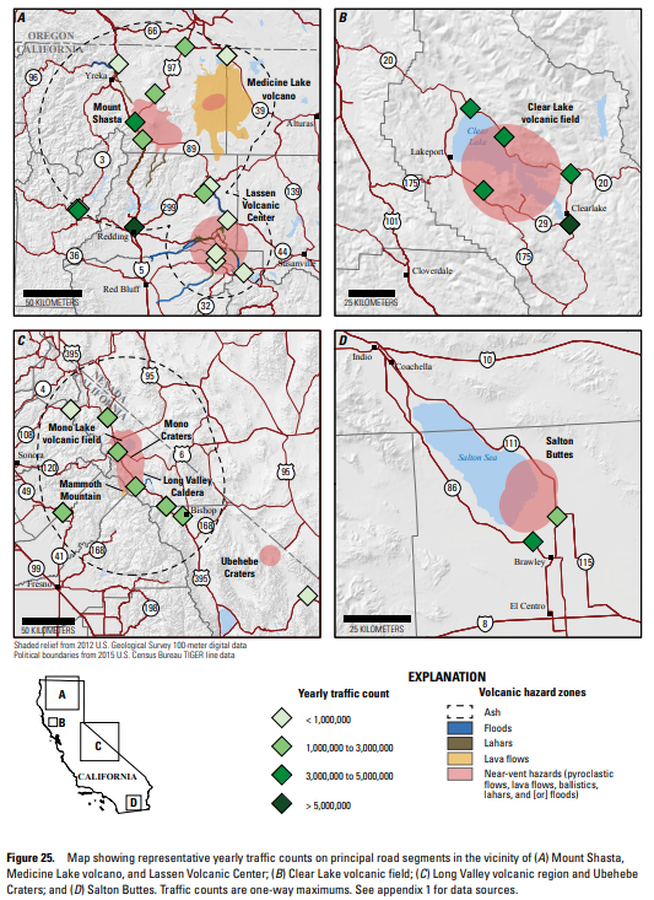
Map showing representative yearly traffic counts on principal road segments in the vicinity of (A) Mount Shasta, Medicine Lake volcano, and Lassen Volcanic Center; (B) Clear Lake volcanic field; (C ) Long Valley volcanic region and Ubehebe Craters; and (D) Salton Buttes
Figure 25 in: Mangan, M., Ball, J., Wood, N., Jones, J.L., Peters, J., Abdollahian, N., Dinitz, L., Blankenheim, S., Fenton, J., & Pridmore, C. (2019). California’s exposure to volcanic hazards. U.S. Geological Survey Scientific Investigations Report 2018–5159, v. 1.1, 49 p. https://doi.org/10.3133/sir20185159
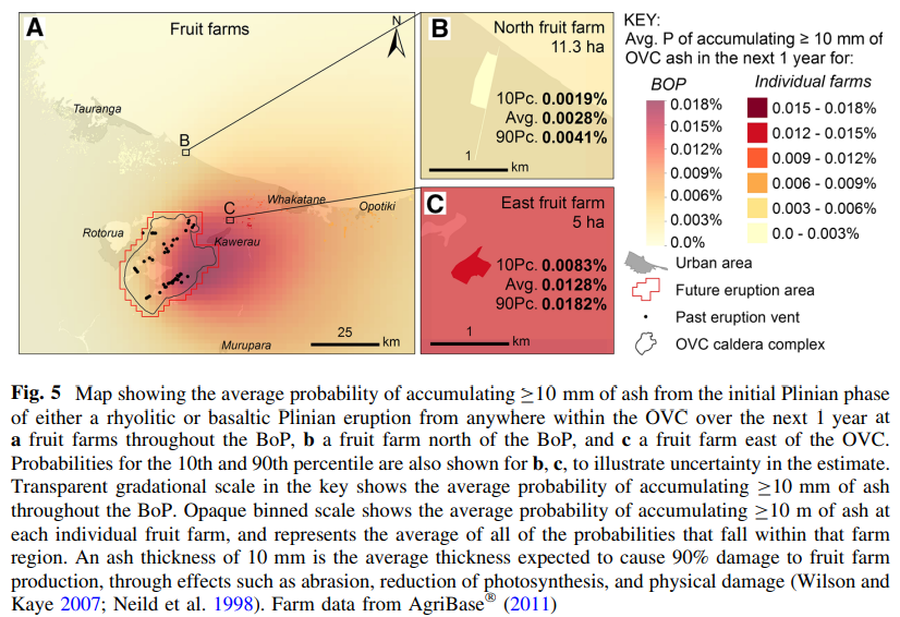
Figure in a journal article
Map showing the average probability of accumulating C10 mm of ash from the initial Plinian phase of either a rhyolitic or basaltic Plinian eruption from anywhere within the OVC over the next 1 year
Figure 5 in: Thompson, M. A., Lindsay, J. M., Wilson, T. M., Biass, S., & Sandri, L. (2017). Quantifying risk to agriculture from volcanic ashfall: a case study from the Bay of Plenty, New Zealand. Natural Hazards, 86(1), 31-56. https://doi.org/10.1007/s11069-016-2672-7
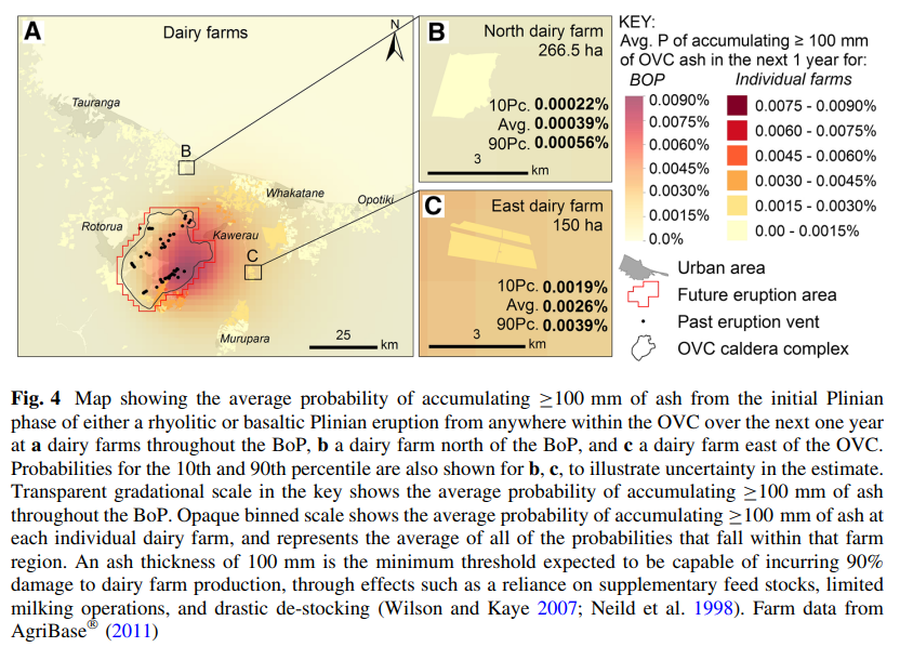
Figure in a journal article
Map showing the average probability of accumulating ≥100 mm of ash from the initial Plinian phase of either a rhyolitic or basaltic Plinian eruption from anywhere within the OVC over the next one year
Figure 4 in: Thompson, M. A., Lindsay, J. M., Wilson, T. M., Biass, S., & Sandri, L. (2017). Quantifying risk to agriculture from volcanic ashfall: a case study from the Bay of Plenty, New Zealand. Natural Hazards, 86(1), 31-56. https://doi.org/10.1007/s11069-016-2672-7
Official, Figure in hazard assessment
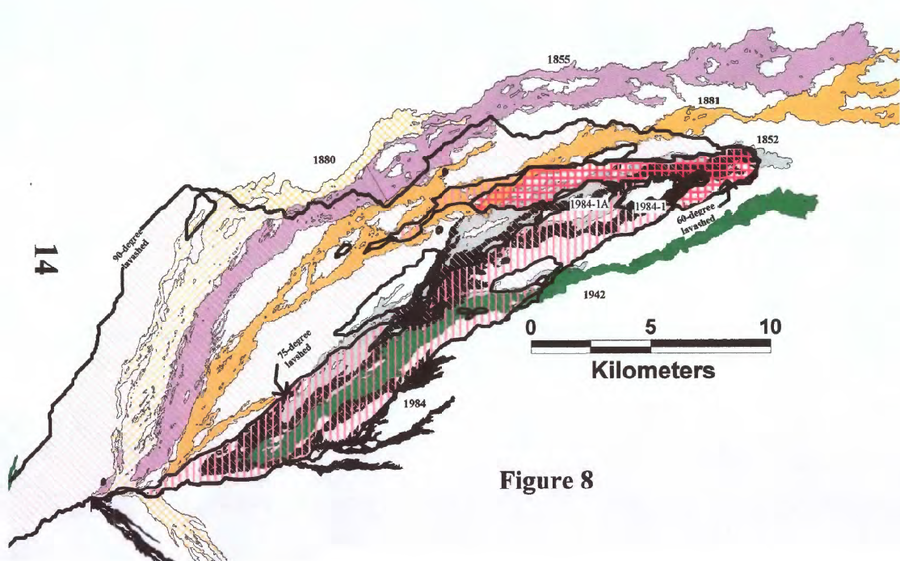
Map showing the nested 60-, 75-, and 90-degree lavasheds computed for the terminal lobes of the Mauna Loa 1984-1 and 1984-1A flows
Figure 8 in: Kauahikaua, J. P., Trusdell, F. A., & Heliker, C. C. (1998). The probability of lava inundation at the proposed and existing Kulani Prison Sites. US Geological Survey, Open-File Report 98-794. 21 p. https://doi.org/10.3133/ofr98794
Official, Figure on website
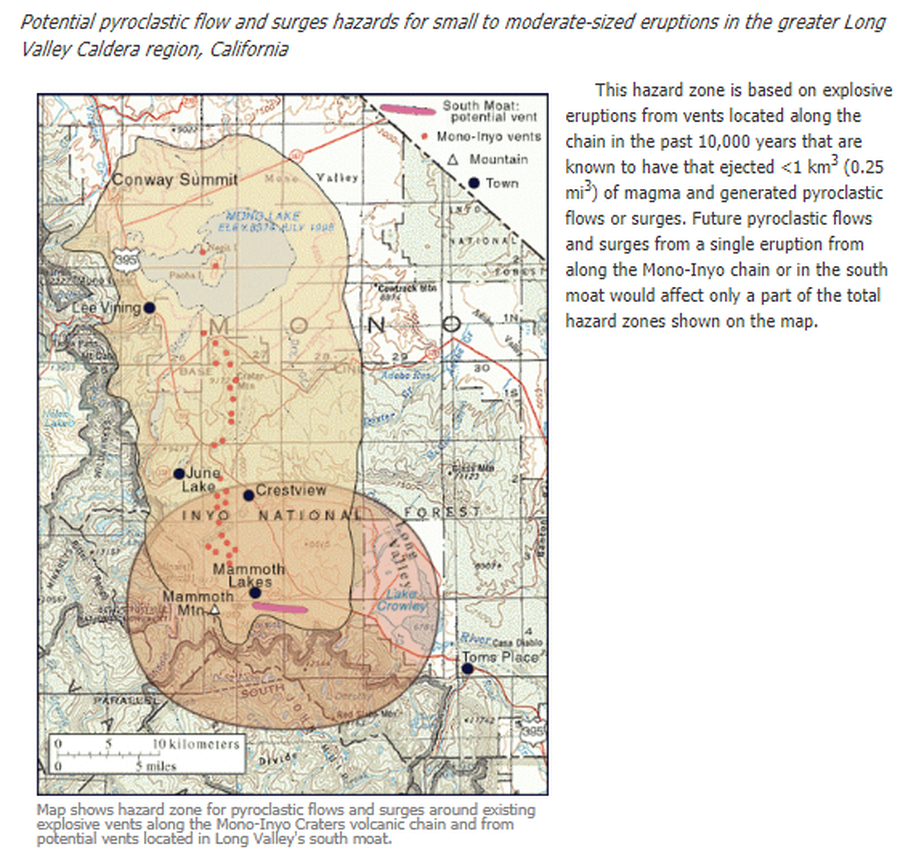
Map shows hazard zone for pyroclastic flows and surges around existing explosive vents along the Mono-Inyo Craters volcanic chain and from potential vents located in Long Valley's south moat
U.S. Geological Survey (USGS). (2012). Map shows hazard zone for pyroclastic flows and surges around existing explosive vents along the Mono-Inyo Craters volcanic chain and from potential vents located in Long Valley's south moat. U.S. Geological Survey. Long Valley Caldera Hazards, Pyroclastic Flow and Surge Hazard Zones from Potential Vents in Long Valley Caldera, California. https://www.usgs.gov/volcanoes/long-valley-caldera/pyroclastic-flow-and-surge-hazard-zones-potential-vents-long-valley