
Advanced Search for Maps
Showing 51-60 of 247
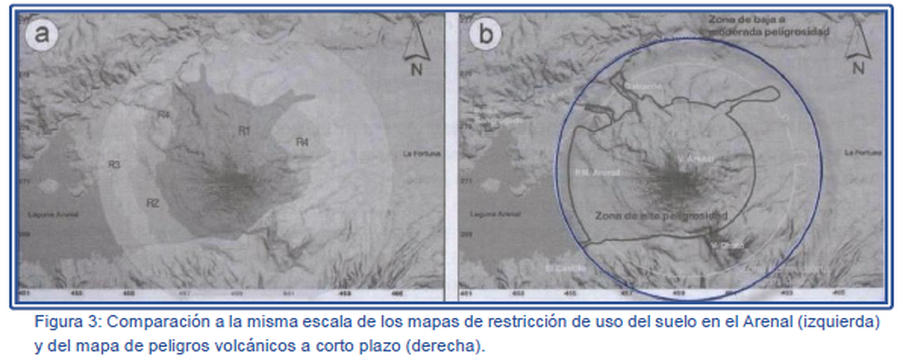
Figure in a journal article
Comparación a la misma escala de los mapas de restricción de uso del suelo en el Arenal (izquierda) y del mapa de peligros volcánicos a corto plazo (derecha).
(Comparison at the same scale of the Arenal land use restriction maps (left) and the short-term volcanic hazard map (right).)
Figure 3 in: Soto, G.J. & Sjöbohm, L. (2007). Los Peligros volcánicos del Arenal. En torno a la Prevencion. Revista No. 4, Junio 2007. Comisión Nacional de Prevención de Riesgos y Atención de Emergencias (CNE).

Official, Figure in hazard assessment
Composite Area of Possible Ash Fallout in Upper Cook Inlet for a Future Eruption of Iliamna Volcano
Figure 9 in: Waythomas, C.F. & Miller, T.P. (1999). Preliminary volcano-hazard assessment for Iliamna Volcano, Alaska. U.S. Geological Survey, Open-File Report 99-373, 31 p., 1 plate. https://doi.org/10.3133/ofr99373
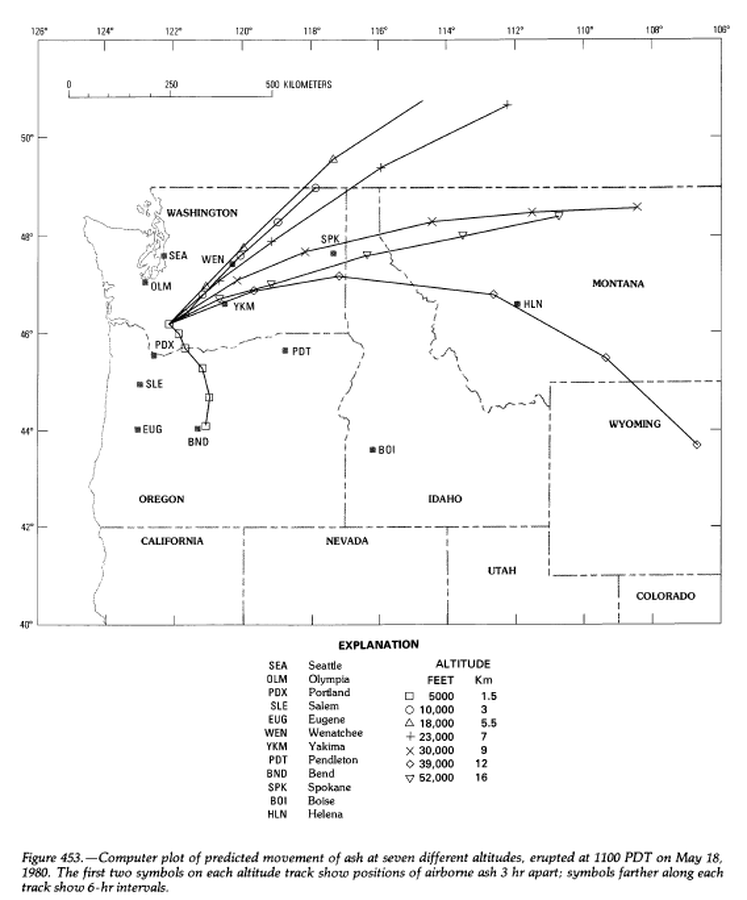
Official, Figure in hazard assessment
Computer plot of predicted movement of ash at seven different altitudes, erupted at 1100 PDT on May 18, 1980.
Figure 453 in: Miller, C.D., Mullineaux, D.R. & Crandell, D.R. (1981). Hazards assessments at Mount St. Helens. In: Lipman, P. W. & Mullineaux, D. R. (Eds.) The 1980 eruptions of Mount St. Helens, Washington. U.S. Geological Survey, Professional Paper 1250, p. 789-802. https://doi.org/10.3133/pp1250
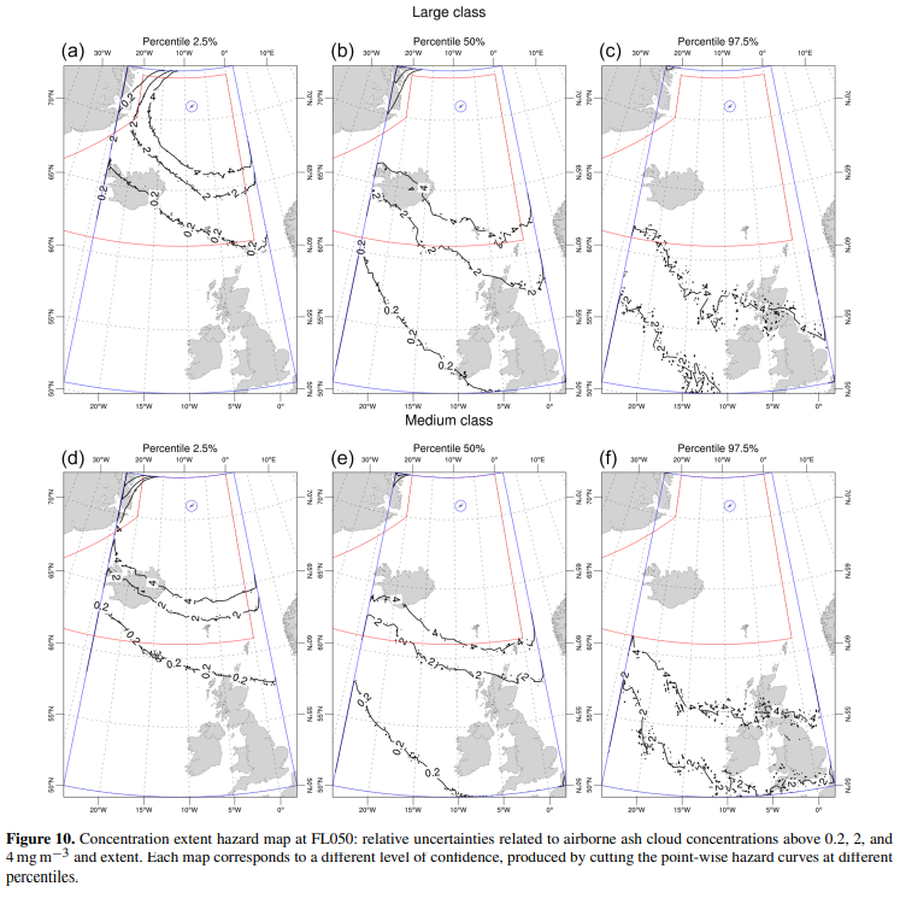
Official, Figure in a journal article
Concentration extent hazard map at FL050
Figure 10 in: Titos, M., Martínez Montesinos, B., Barsotti, S., Sandri, L., Folch, A., Mingari, L., Macedonio, G. & Costa, A. (2022). Long-term hazard assessment of explosive eruptions at Jan Mayen (Norway) and implications for air traffic in the North Atlantic. Natural Hazards and Earth System Sciences, 22(1), 139-163. https://doi.org/10.5194/nhess-22-139-2022
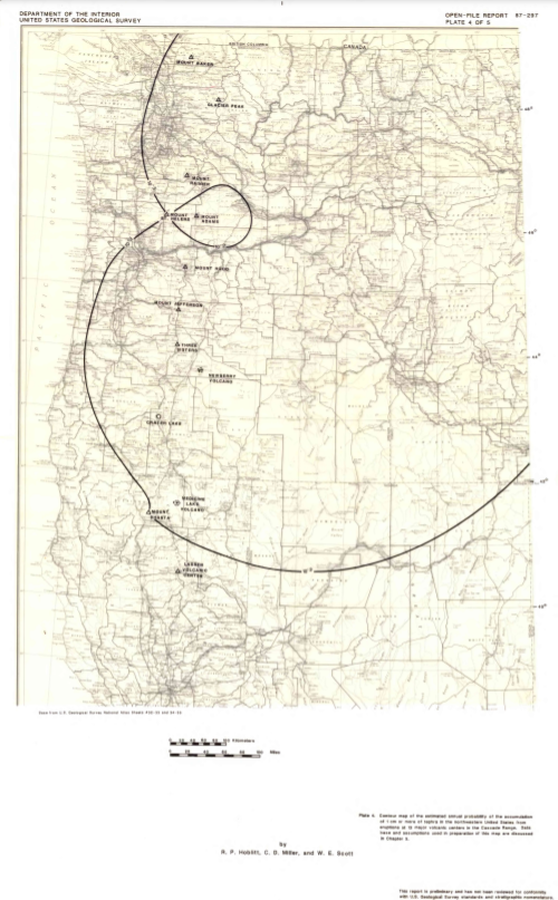
Official, Insert/poster-size map with accompanying report
Contour map of the estimated annual probability of the accumulation of 1 cm or more of tephra in the northwestern United States at eruptions at 13 major volcanic centers in the Cascades Range
Plate 4 in: Hoblitt, R. P., Miller, C. D., & Scott, W. E. (1987). Volcanic hazards with regard to siting nuclear-power plants in the Pacific Northwest. U.S. Geological Survey, Open-File Report 87-297. https://doi.org/10.3133/ofr87297
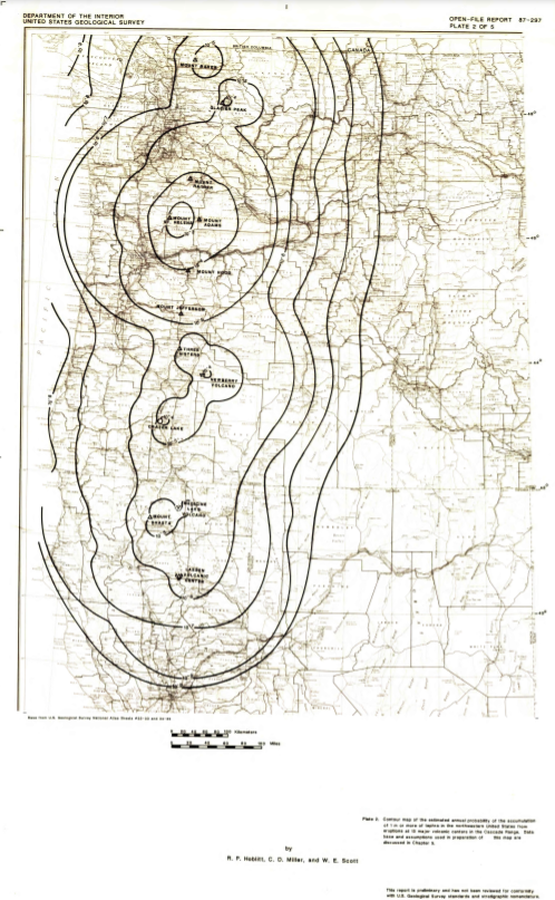
Official, Insert/poster-size map with accompanying report
Contour map of the estimated annual probability of the accumulation of 1 m or more of tephra in the northwestern United States at eruptions at 13 major volcanic centers in the Cascades Range
Plate 2 in: Hoblitt, R. P., Miller, C. D., & Scott, W. E. (1987). Volcanic hazards with regard to siting nuclear-power plants in the Pacific Northwest. U.S. Geological Survey, Open-File Report 87-297. https://doi.org/10.3133/ofr87297
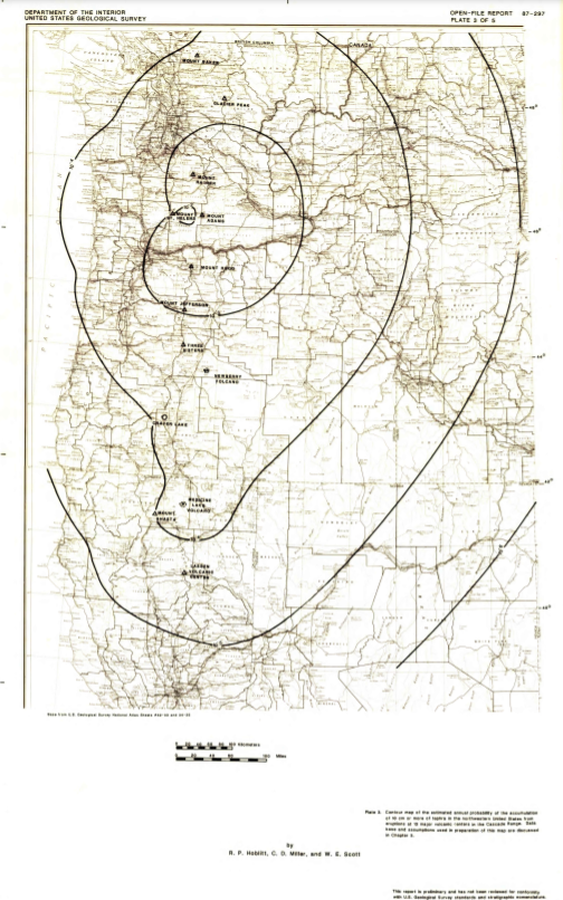
Official, Insert/poster-size map with accompanying report
Contour map of the estimated annual probability of the accumulation of 10 cm or more of tephra in the northwestern United States at eruptions at 13 major volcanic centers in the Cascades Range
Plate 3 in: Hoblitt, R. P., Miller, C. D., & Scott, W. E. (1987). Volcanic hazards with regard to siting nuclear-power plants in the Pacific Northwest. U.S. Geological Survey, Open-File Report 87-297. https://doi.org/10.3133/ofr87297
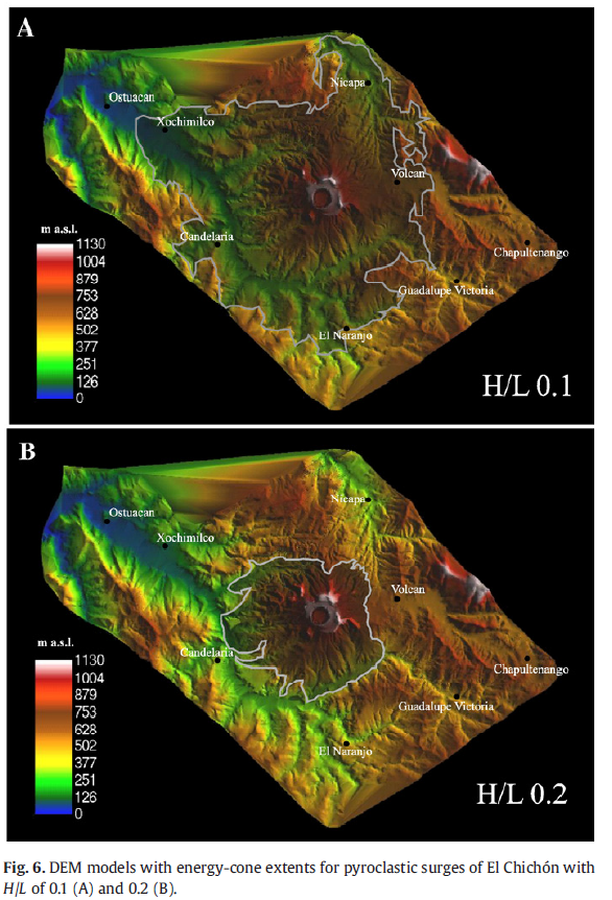
Figure in a journal article
DEM models with energy-cone extents for pyroclastic surges of El Chichón with H/L of 0.1 (A) and 0.2 (B).
Figure 6 in: Macías, J. L., Capra, L., Arce, J. L., Espíndola, J. M., García-Palomo, A., & Sheridan, M. F. (2008). Hazard map of El Chichón volcano, Chiapas, México: Constraints posed by eruptive history and computer simulations. Journal of Volcanology and Geothermal Research, 175(4), 444-458. https://doi.org/10.1016/j.jvolgeores.2008.02.023

Official, Figure in hazard assessment
Diagrammatic representation (best guess) of relative risk on Oahu from fallout of tephra originating in the zone of most recent volcanism.
Figure 2 in: Crandell, D. R. (1975). Assessment of volcanic risk on the island of Oahu, Hawaii. U.S. Geological Survey, Open-File Report 75-287. https://doi.org/10.3133/ofr75287
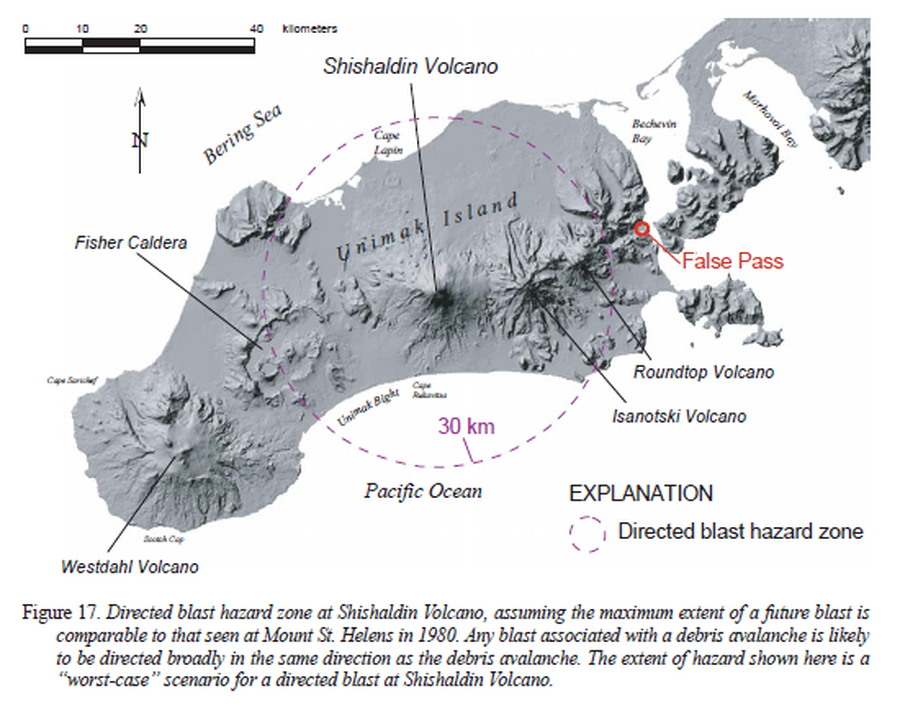
Official, Figure in hazard assessment
Directed blast hazard zone at Shishaldin Volcano
Figure 17 in: Beget, J.E., Nye, C.J., Schaefer, J.R. & Stelling, P.L. (2003). Preliminary volcano-hazard assessment for Shishaldin Volcano, Alaska. Alaska Division of Geological & Geophysical Surveys, Report of Investigations 2002-4, 28 p., 1 sheet, scale 1:500,000. http://doi.org/10.14509/2872