
Advanced Search for Maps
Showing 61-70 of 247
Eldey, Iceland
Official, Interactive web-based map
Eldey, possible range of isopachs based on submarine eruptions on Reykjanes volcanic system (cm) - After Jakobsson S.P. (Unpublished material)
Larsen, G. (2019). Eldey. In: Oladottir, B., Larsen, G. & Guðmundsson, M. T. Catalogue of Icelandic Volcanoes. Iceland Meteorological Office (IMO), Univeristy of Iceland, and Civil Protection Department of the National Commissioner of the Iceland Police (CPD-NCIP). (Simplified from: S.P. Jakobsson Unpublished data)
Official, Figure in hazard assessment
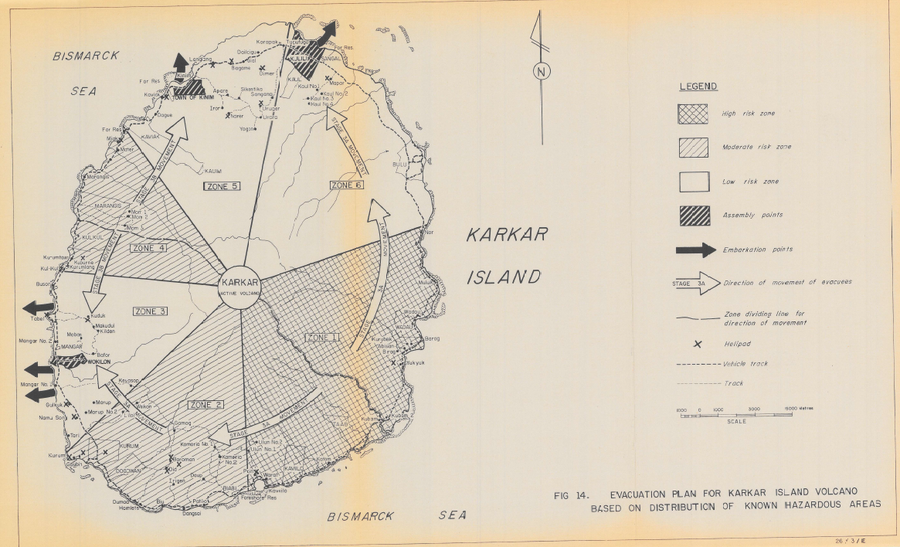
Evacuation Plan for Karkar Island Volcano Based on Distribution of Known Hazardous Areas
Figure 14 in: Lowenstein, P.L. (1982). Problems of volcanic hazards in Papua New Guinea. Geological Survey of Papua New Guinea, Report 82/7, 62 p.
Official, Figure in a journal article
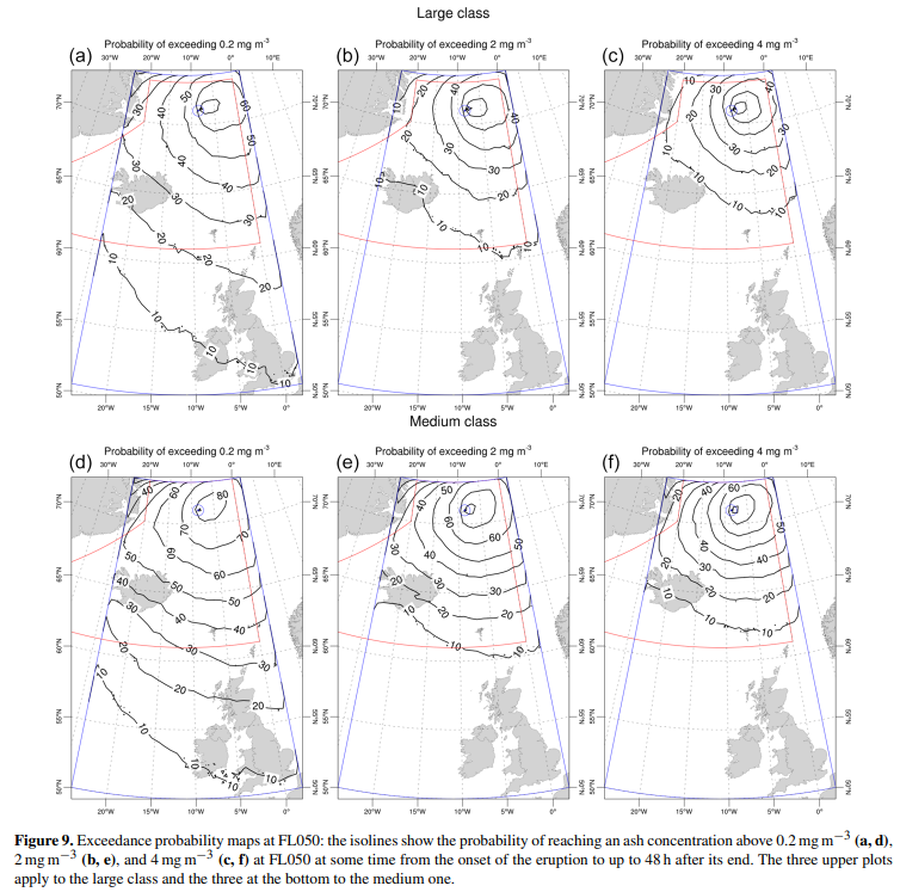
Exceedance probability maps at FL050
Figure 9 in: Titos, M., Martínez Montesinos, B., Barsotti, S., Sandri, L., Folch, A., Mingari, L., Macedonio, G. & Costa, A. (2022). Long-term hazard assessment of explosive eruptions at Jan Mayen (Norway) and implications for air traffic in the North Atlantic. Natural Hazards and Earth System Sciences, 22(1), 139-163. https://doi.org/10.5194/nhess-22-139-2022
Official, Figure in a journal article
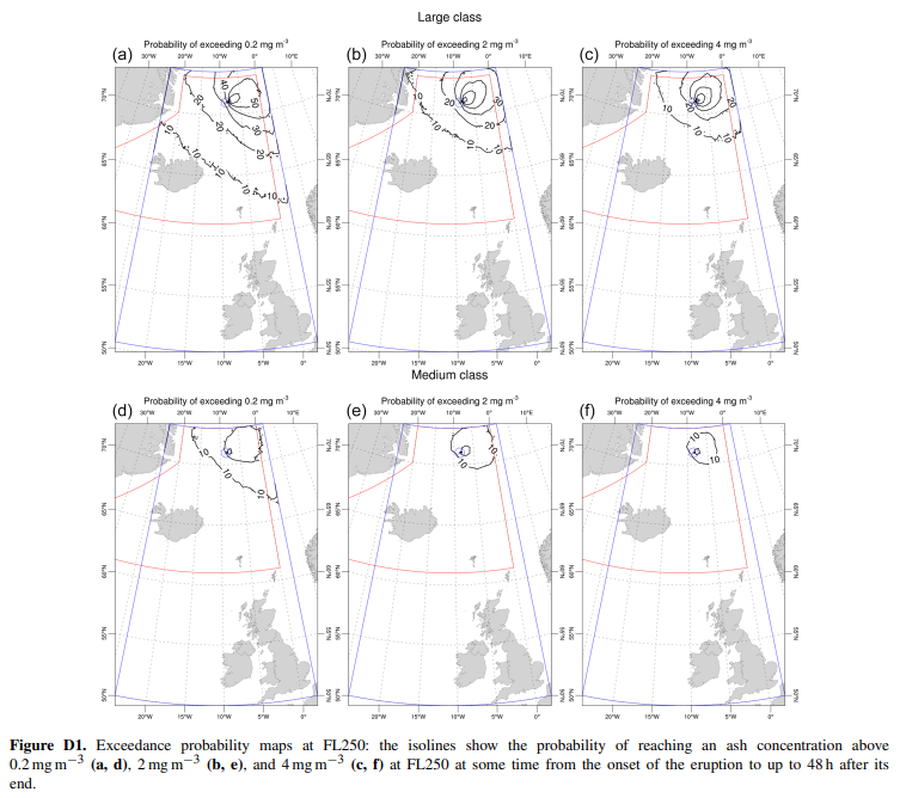
Exceedance probability maps at FL250
Figure D1 in: Titos, M., Martínez Montesinos, B., Barsotti, S., Sandri, L., Folch, A., Mingari, L., Macedonio, G. & Costa, A. (2022). Long-term hazard assessment of explosive eruptions at Jan Mayen (Norway) and implications for air traffic in the North Atlantic. Natural Hazards and Earth System Sciences, 22(1), 139-163. https://doi.org/10.5194/nhess-22-139-2022
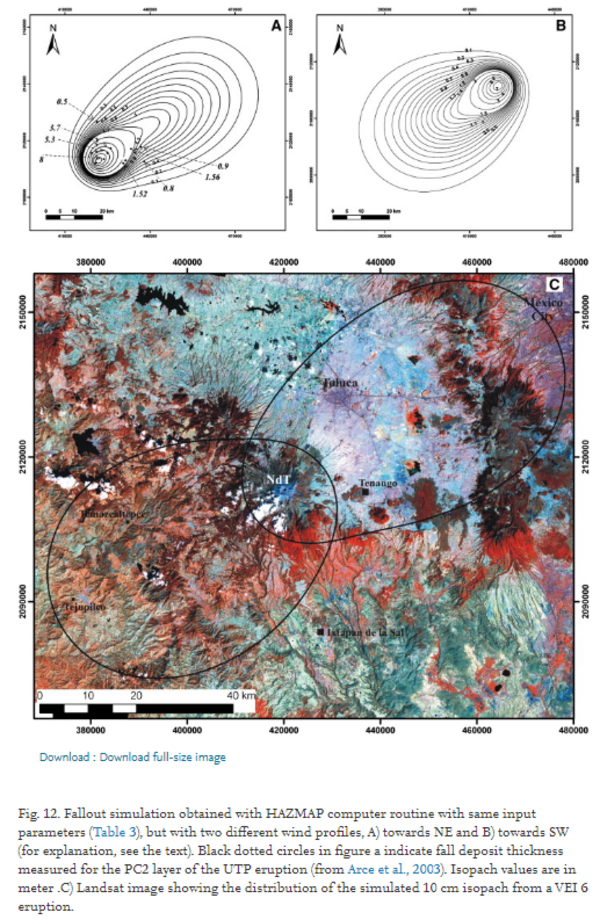
Figure in a journal article
Fallout simulation obtained with HAZMAP computer routine with same input parameters (Table 3), but with two different wind profiles
Figure 12 in: Capra, L., Norini, G., Groppelli, G., Macías, J.L., & Arce, J.L. (2008). Volcanic hazard zonation of the Nevado de Toluca volcano, México. Journal of Volcanology and Geothermal Research, 176(4), p. 469-484. https://doi.org/10.1016/j.jvolgeores.2008.04.016
Official, Figure in hazard assessment
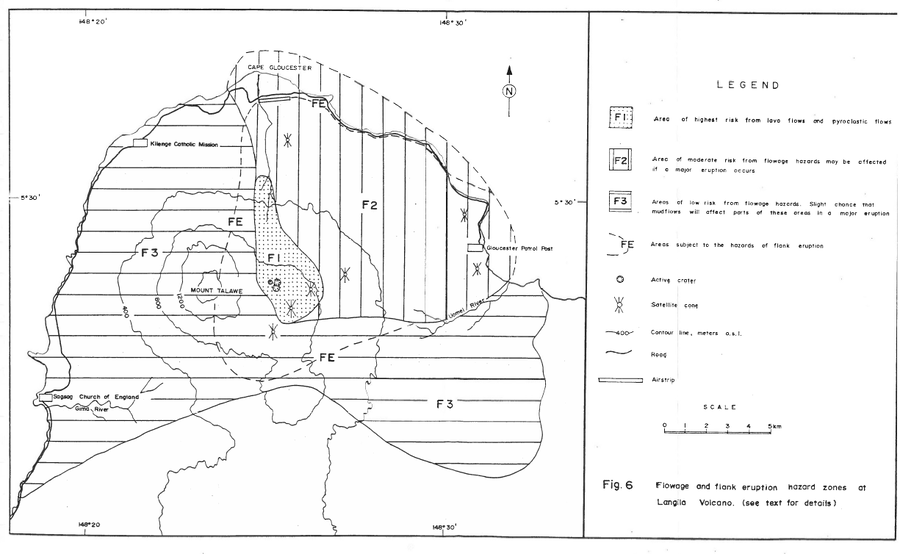
Flowage and flank eruption hazard zones at Langila Volcano
Figure 6 in: Talai, B. (1987). Volcanic hazards at Langila volcano. Geological Survey of Papua New Guinea, Report 87/25
Official, Figure in hazard assessment
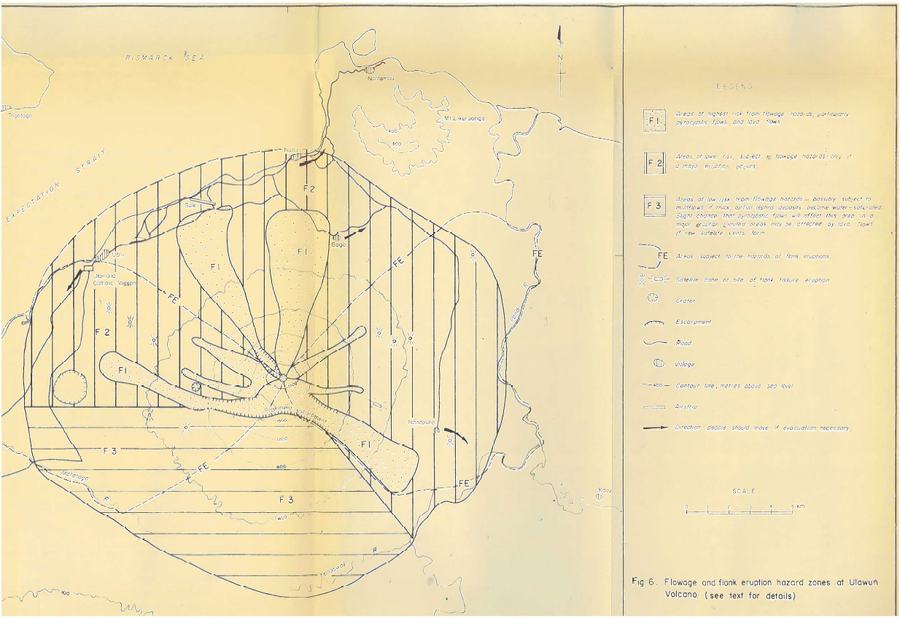
Flowage and flank eruption hazard zones at Ulawun Volcano
Figure 6 in: McKee, C.O. (1983). Volcanic hazards at Uluwan volcano. Geological Survey of Papua New Guinea, Report 83/13, 1:100,000
Official, Figure in hazard assessment
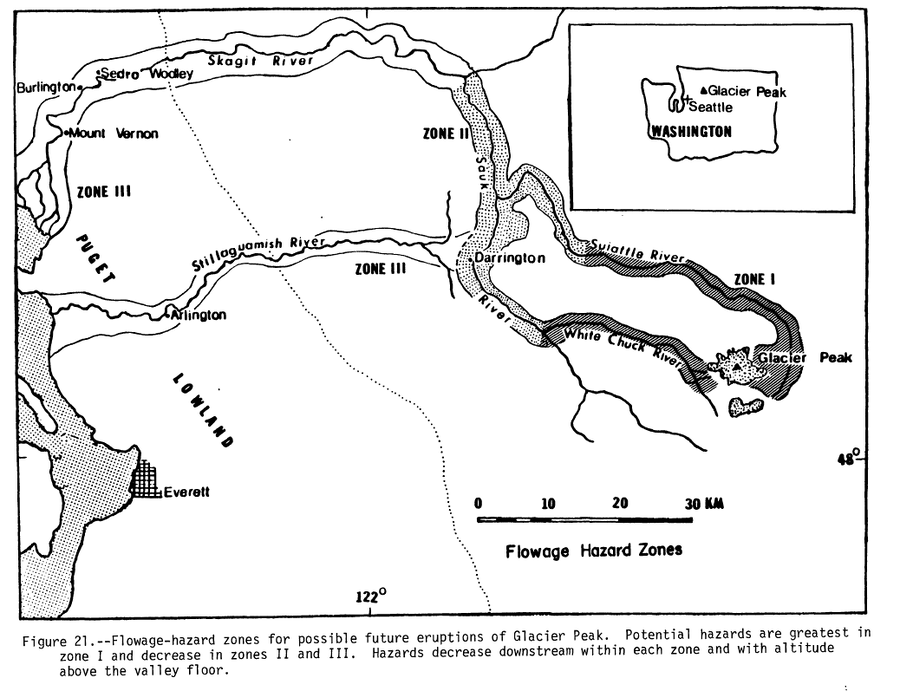
Flowage Hazard Zones
Figure 21 in: Beget, J.E. (1982). Postglacial Volcanic Deposits at Glacier Peak, Washington, and Potential Hazards from Future Eruptions. U.S. Geological Survey, Open-File Report 82-830, 81 p. https://doi.org/10.3133/ofr82830
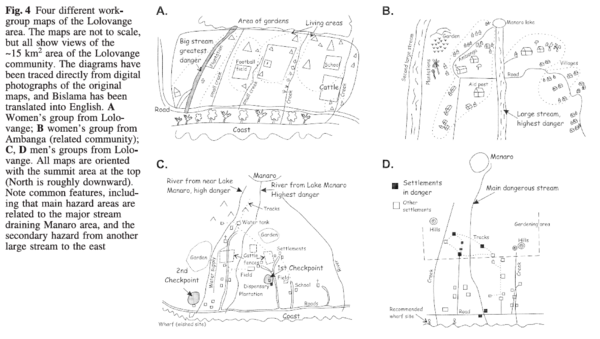
Figure in a journal article
Four different workgroup maps of the Lolovange area
Figure 4 in: Cronin, S.J., Gaylord, D.R., Charley, D., Alloway, B.V., Wallez, S., & Esau, J.W. (2004). Participatory methods of incorporating scientific with traditional knowledge for volcanic hazard management on Ambae Island, Vanuatu. Bulletin of volcanology, 66(7), p. 652-668. https://doi.org/10.1007/s00445-004-0347-9
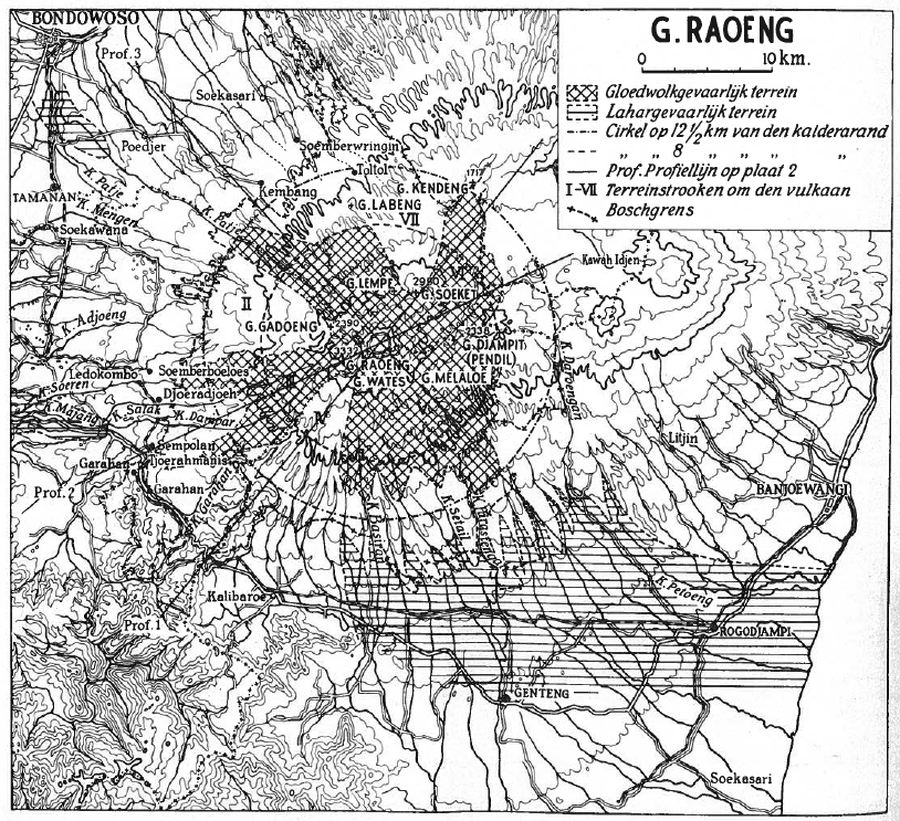
Figure in a journal article
G. Raoeng
Neumann van Padang, M. (1937). De gevaarlijke stroken om den Raoeng. De bergcultures : officieel orgaan van het Algemeen Landbouw Syndicaat, 11 (8), p. 229-237.