
Advanced Search for Maps
Showing 21-30 of 372
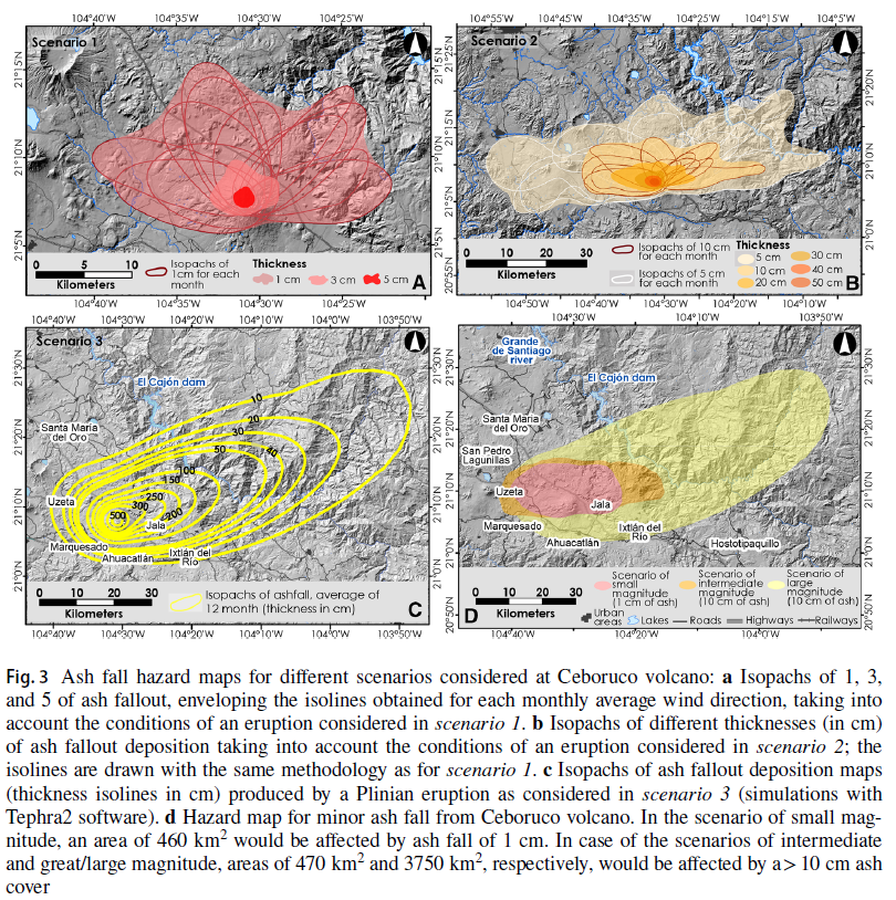
Figure in a journal article
Ash fall hazard maps for different scenarios considered at Ceboruco volcano
Figure 3 in: Sieron, K., Ferrés, D., Siebe, C., Constantinescu, R., Capra, L., Connor, C., Connor, L., Groppelli, G. & Zuccolotto, K.G. (2019). Ceboruco hazard map: part II—modeling volcanic phenomena and construction of the general hazard map. Natural Hazards, 96(2), p. 893-933. https://doi.org/10.1007/s11069-019-03577-5
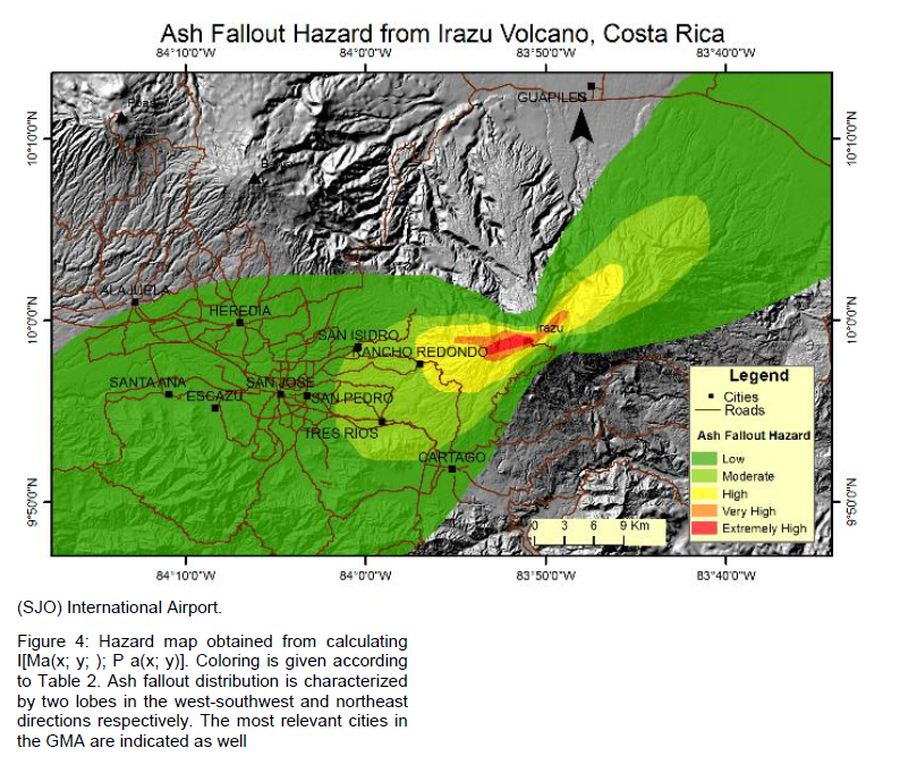
Figure in a journal article
Ash Fallout Hazard from Irazu Volcano, Costa Rica
Figure 4 in: Barrantes, G., Núñez, S., & Malavassi, E. (2018). Ash fallout hazard from Irazú volcano, Costa Rica. Revista Geográfica de Chile Terra Australis, 54(1), 13-25. https://doi.org/10.23854/07199562.2018541Barrantes13

Figure in a journal article
Ash fallout simulations (thickness) with a 5-km column height and volume of 0.3 km³
Figure 10 in: Bartolini, S., Geyer, A., Martí, J., Pedrazzi, D., & Aguirre-Díaz, G. (2014). Volcanic hazard on Deception Island (South Shetland Islands, Antarctica). Journal of Volcanology and Geothermal Research, 285, p. 150-168. https://doi.org/10.1016/j.jvolgeores.2014.08.009
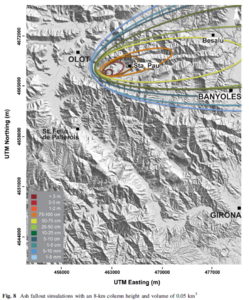
Figure in a journal article
Ash fallout simulations with an 8-km column height and volume of 0.05 km³
Figure 8 in: Bartolini, S., Bolós, X., Martí, J., Pedra, E. R., & Planagumà, L. (2015). Hazard assessment at the quaternary La Garrotxa volcanic field (NE Iberia). Natural Hazards, 78(2), 1349-1367. https://doi.org/10.1007/s11069-015-1774-y
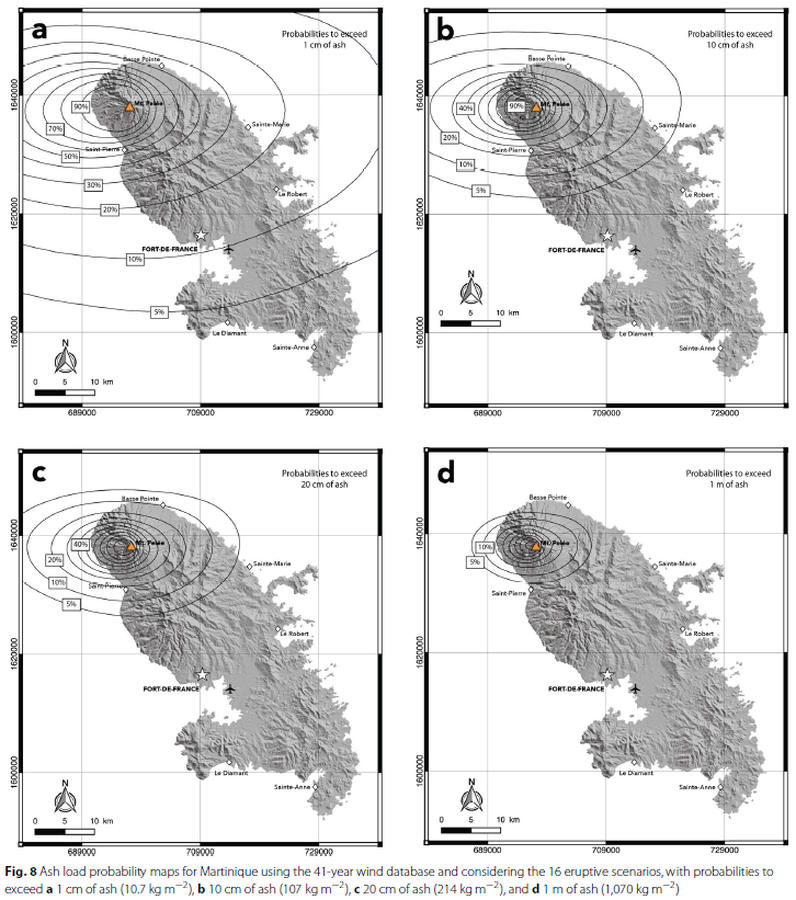
Figure in a journal article
Ash load probability maps for Martinique using the 41-year wind database and considering the 16 eruptive scenarios
Figure 8 in: Michaud-Dubuy, A., Carazzo, G., & Kaminski, E. (2021). Volcanic hazard assessment for tephra fallout in Martinique. Journal of Applied Volcanology, 10(1), 1-20. https://doi.org/10.1186/s13617-021-00106-7.
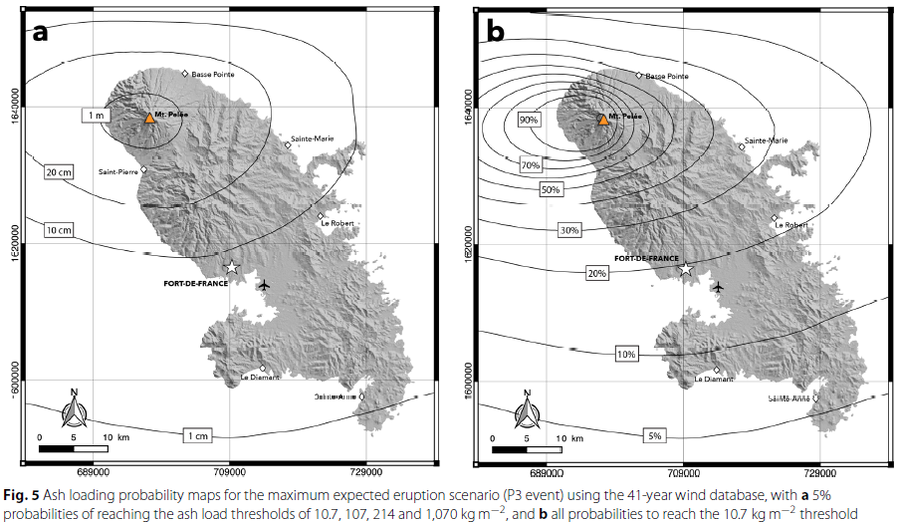
Figure in a journal article
Ash loading probability maps for the maximum expected eruption scenario
Figure 5 in: Michaud-Dubuy, A., Carazzo, G., & Kaminski, E. (2021). Volcanic hazard assessment for tephra fallout in Martinique. Journal of Applied Volcanology, 10(1), 1-20. https://doi.org/10.1186/s13617-021-00106-7.
Official, Figure in a journal article
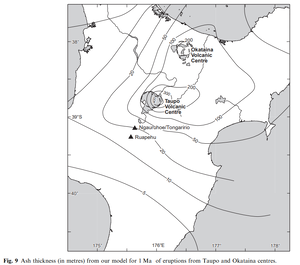
Ash thickness (in metres) from our model for 1 Ma of eruptions from Taupo and Okataina centres
Figure 9 in: Hurst, T. & Smith, W. (2010). Volcanic ashfall in New Zealand–probabilistic hazard modelling for multiple sources. New Zealand Journal of Geology and Geophysics, 53(1), 1-14. https://doi.org/10.1080/00288301003631129
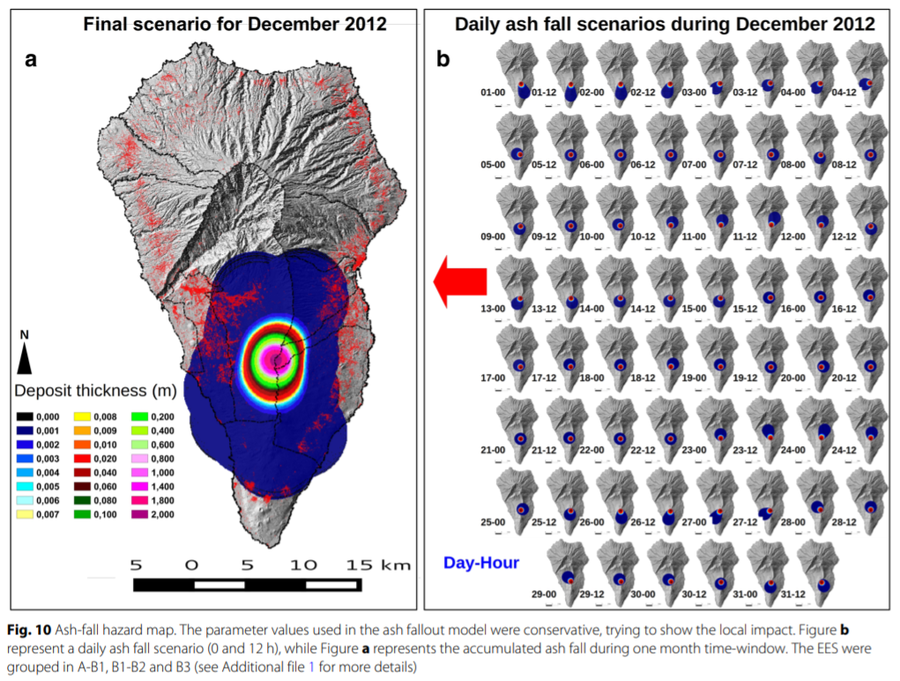
Figure in a journal article
Ash-fall hazard map
Figure 10 in: Marrero, J. M., García, A., Berrocoso, M., Llinares, Á., Rodríguez-Losada, A., & Ortiz, R. (2019). Strategies for the development of volcanic hazard maps in monogenetic volcanic fields: the example of La Palma (Canary Islands). Journal of Applied Volcanology, 8(1), 6. https://doi.org/10.1186/s13617-019-0085-5
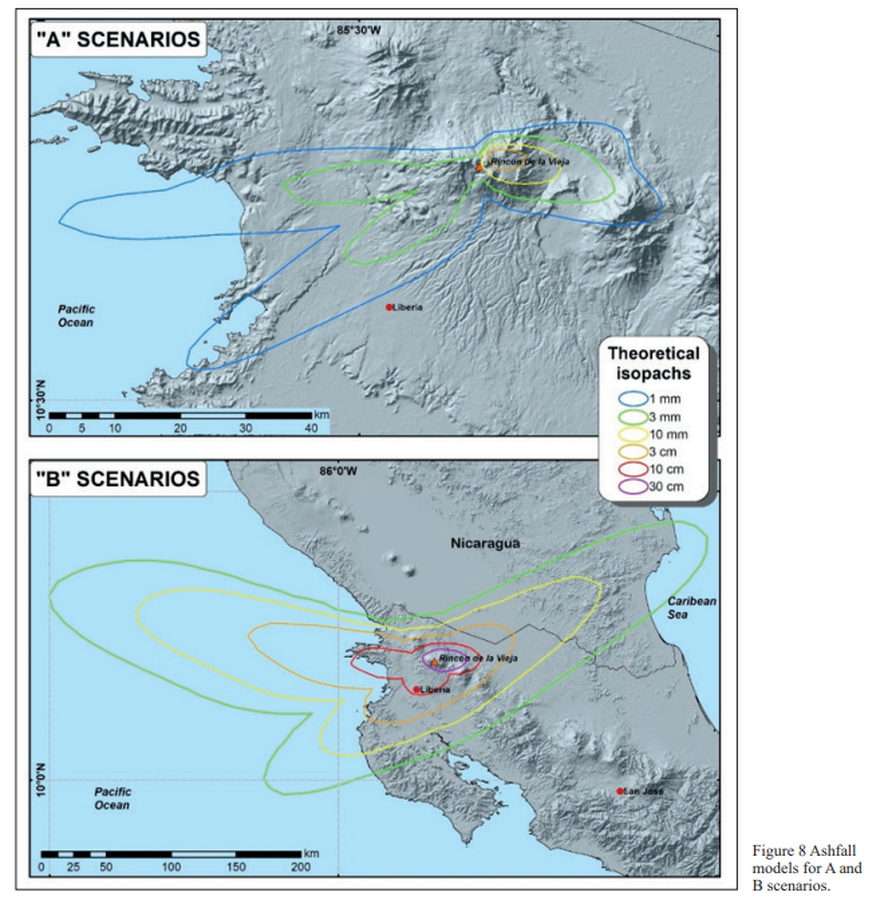
Figure in a journal article
Ashfall models for A and B scenarios
Figure 8 in: Alpízar, Y., Fernández, M., Ramírez, C., & Arroyo, D. (2019). Hazard Map of Rincón de la Vieja Volcano, Costa Rica: Qualitative Integration of Computer Simulations and Geological Data. Anuario do Instituto de Geociencias, 42(3). http://dx.doi.org/10.11137/2019_3_474_488
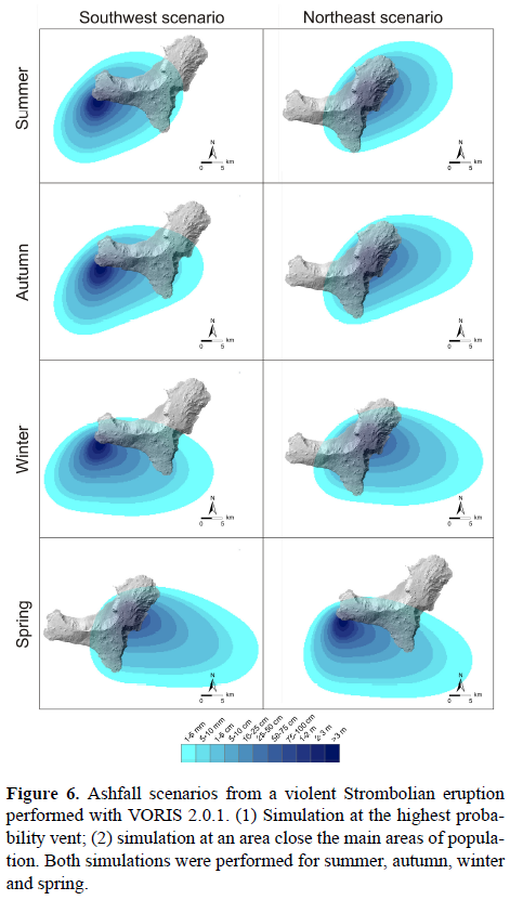
Figure in a journal article
Ashfall scenarios from a violent Strombolian eruption performed with VORIS 2.0.1.
Figure 6 in: Becerril, L., Bartolini, S., Sobradelo, R., Martí, J., Morales, J. M., & Galindo, I. (2014). Long-term volcanic hazard assessment on El Hierro (Canary Islands). Natural Hazards and Earth System Sciences, 14(7), 1853-1870. https://doi.org/10.5194/nhess-14-1853-2014, 2014