
Advanced Search for Maps
Showing 61-70 of 372
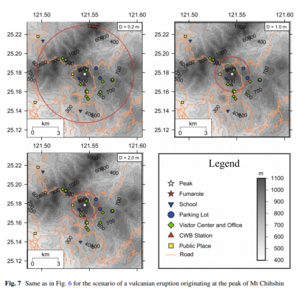
Figure in a journal article
Delineation of impact areas for three VBP diameters ejected during the scenario of a vulcanian eruption originating at the peak of Mt Chihshin
Figure 7 in: Nurmawati, A., & Konstantinou, K. I. (2018). Hazard assessment of volcanic ballistic impacts at Mt Chihshin, Tatun Volcano Group, northern Taiwan. Natural hazards, 92(1), p. 77-92. https://doi.org/10.1007/s11069-018-3192-4
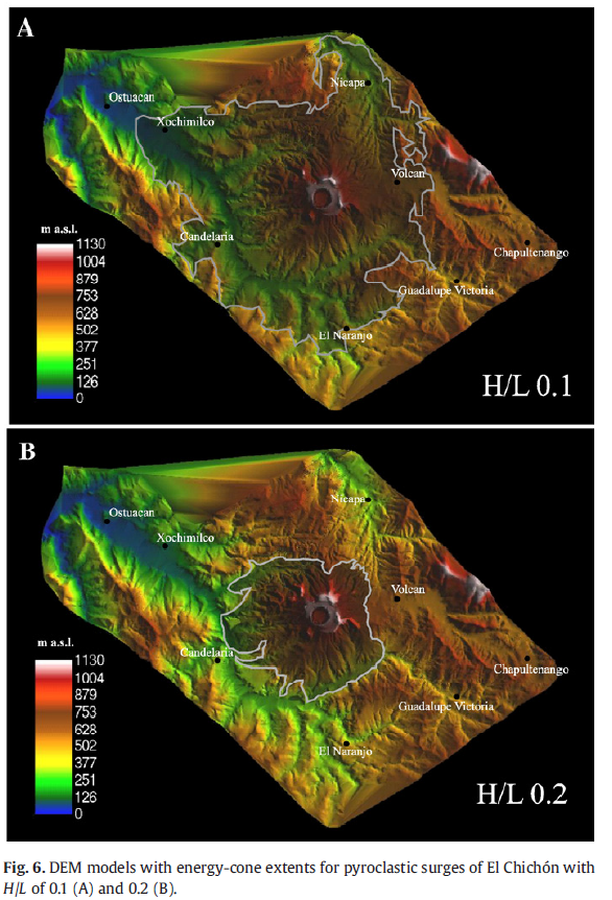
Figure in a journal article
DEM models with energy-cone extents for pyroclastic surges of El Chichón with H/L of 0.1 (A) and 0.2 (B).
Figure 6 in: Macías, J. L., Capra, L., Arce, J. L., Espíndola, J. M., García-Palomo, A., & Sheridan, M. F. (2008). Hazard map of El Chichón volcano, Chiapas, México: Constraints posed by eruptive history and computer simulations. Journal of Volcanology and Geothermal Research, 175(4), 444-458. https://doi.org/10.1016/j.jvolgeores.2008.02.023
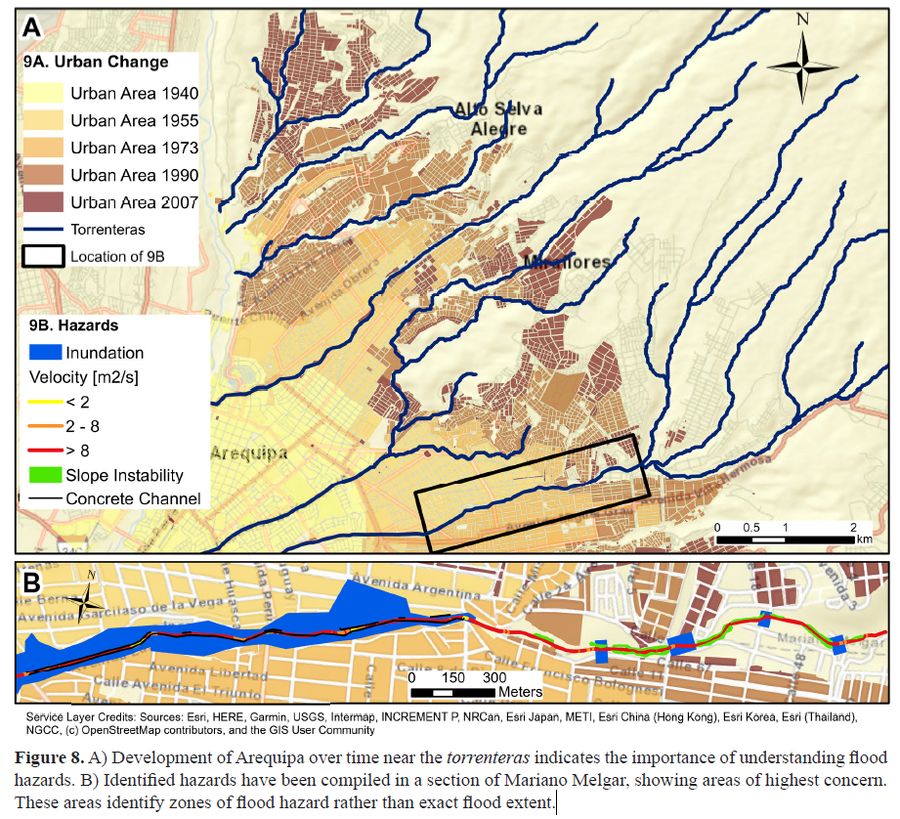
Figure in a journal article
Development of Arequipa over time near the torrenteras indicates the importance of understanding flood hazards
Figure 8 in: Mazer, K. E., Tomasek, A. A., Daneshvar, F., Bowling, L. C., Frankenberger, J. R., McMillan, S. K., Novoa, H.M., & Zeballos‐Velarde, C. (2021). Integrated hydrologic and hydraulic analysis of torrential flood hazard in Arequipa, Peru. Journal of Contemporary Water Research & Education, 171(1), 93-110. https://doi.org/10.1111/j.1936-704X.2020.3347.x

Figure in a journal article
Early simulations carried out before the onset of the effusive eruption
Figure 4 in: Tarquini, S., de'Michieli Vitturi, M., Jensen, E. H., Pedersen, G. B., Barsotti, S., Coppola, D., & Pfeffer, M. A. (2018). Modeling lava flow propagation over a flat landscape by using MrLavaLoba: the case of the 2014–2015 eruption at Holuhraun, Iceland. Annals of Geophysics. https://doi.org/10.4401/ag-7812
Official, Figure in a journal article
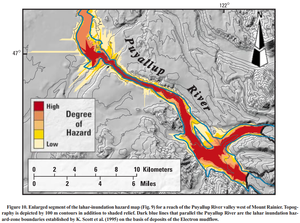
Enlarged segment of the lahar-inundation hazard map (Fig. 9) for a reach of the Puyallup River valley west of Mount Rainier
Figure 10 in: Iverson, R. M., Schilling, S. P., & Vallance, J. W. (1998). Objective delineation of lahar-inundation hazard zones. Geological Society of America Bulletin, 110(8), 972-984. https://doi.org/10.1130/0016-7606(1998)110<0972:ODOLIH>2.3.CO;2

Figure in a journal article
Estimated Travel Time of Mudflows at Mount Hood, Oregon
Preppernau, C. A., & Jenny, B. (2016). Estimated travel time of mudflows at Mount Hood, Oregon. Journal of Maps, 12(5), p. 711-715. https://doi.org/10.1080/17445647.2015.1120244
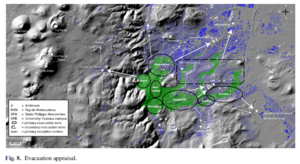
Figure in a journal article
Evacuation appraisal
Figure 8 in: Latutrie, B., Andredakis, I., De Groeve, T., Harris, A. J. L., Langlois, E., de Vries, B. V. W., Saubin, E., Bilotta, G., Cappello, A., Crisci, G.M., D'ambrosio, D., Del Negro, C., Favalli, M., Fujita, E., Iovine, G., Kelfoun, K., Rongo, R., Spataro, W., Tarquini, S., Coppola, D., Ganci, G., Marchese, F., Pergola, N., & Tramutoli, V. (2016). Testing a geographical information system for damage and evacuation assessment during an effusive volcanic crisis. In: Harris, A.J.L., De Groeve, T., & Carn, S.A. (Eds.) Detecting, Modelling and Responding to Effusive Eruptions. Geological Society, London, Special Publications, 426(1), p. 649-672. https://doi.org/10.1144/SP426.19
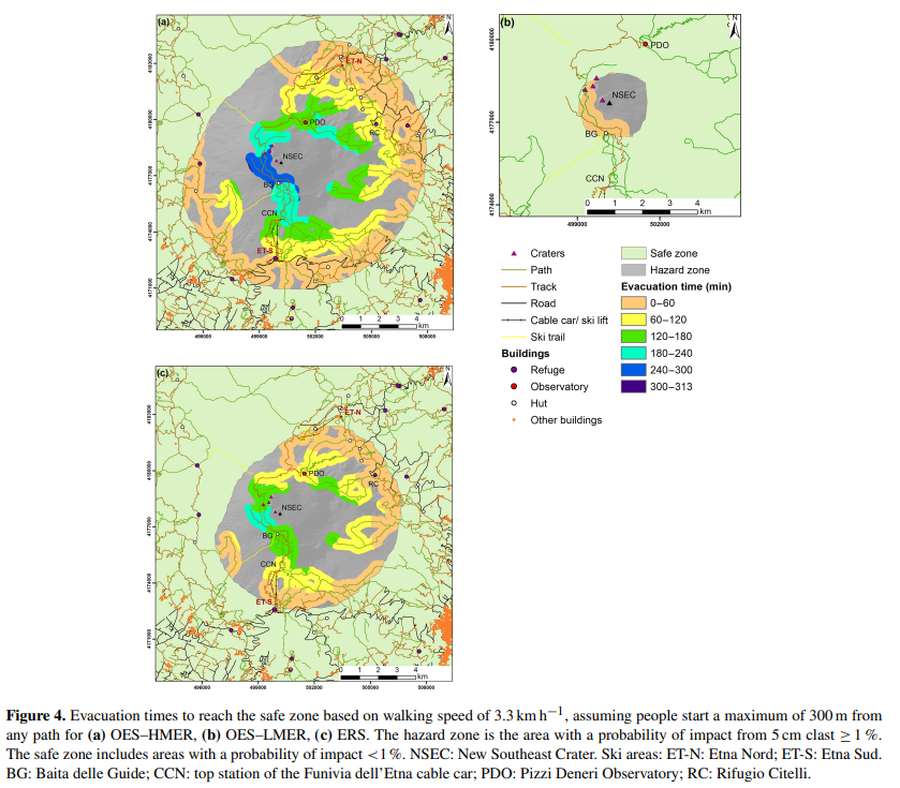
Figure in a journal article
Evacuation times to reach the safe zone based on walking speed of 3.3 km h^−1
Figure 4 in: Osman, S., Rossi, E., Bonadonna, C., Frischknecht, C., Andronico, D., Cioni, R., & Scollo, S. (2019). Exposure-based risk assessment and emergency management associated with the fallout of large clasts at Mount Etna. Natural Hazards and Earth System Sciences, 19(3), 589-610. https://doi.org/10.5194/nhess-19-589-2019
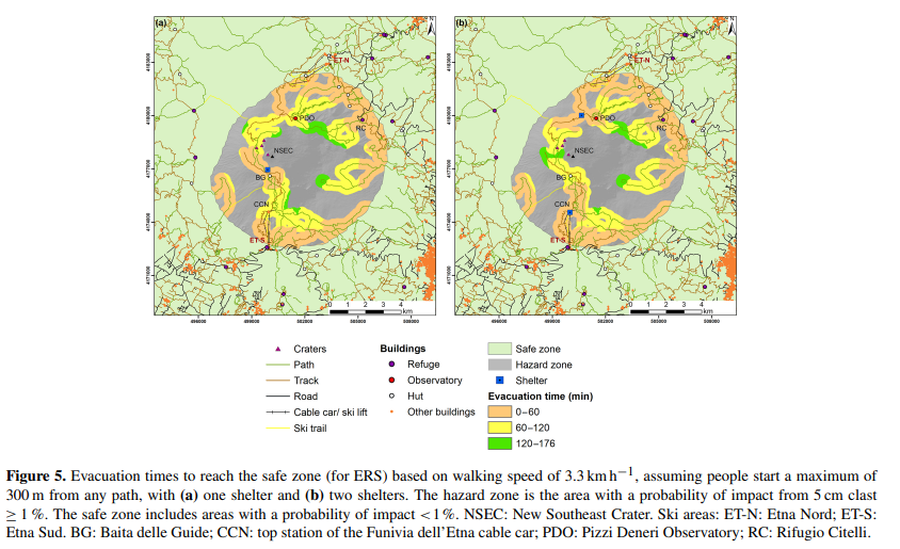
Figure in a journal article
Evacuation times to reach the safe zone based on walking speed of 3.3 km h^−1, assuming people start a maximum of 300 m from any path, with (a) one shelter and (b) two shelters
Figure 5 in: Osman, S., Rossi, E., Bonadonna, C., Frischknecht, C., Andronico, D., Cioni, R., & Scollo, S. (2019). Exposure-based risk assessment and emergency management associated with the fallout of large clasts at Mount Etna. Natural Hazards and Earth System Sciences, 19(3), 589-610. https://doi.org/10.5194/nhess-19-589-2019
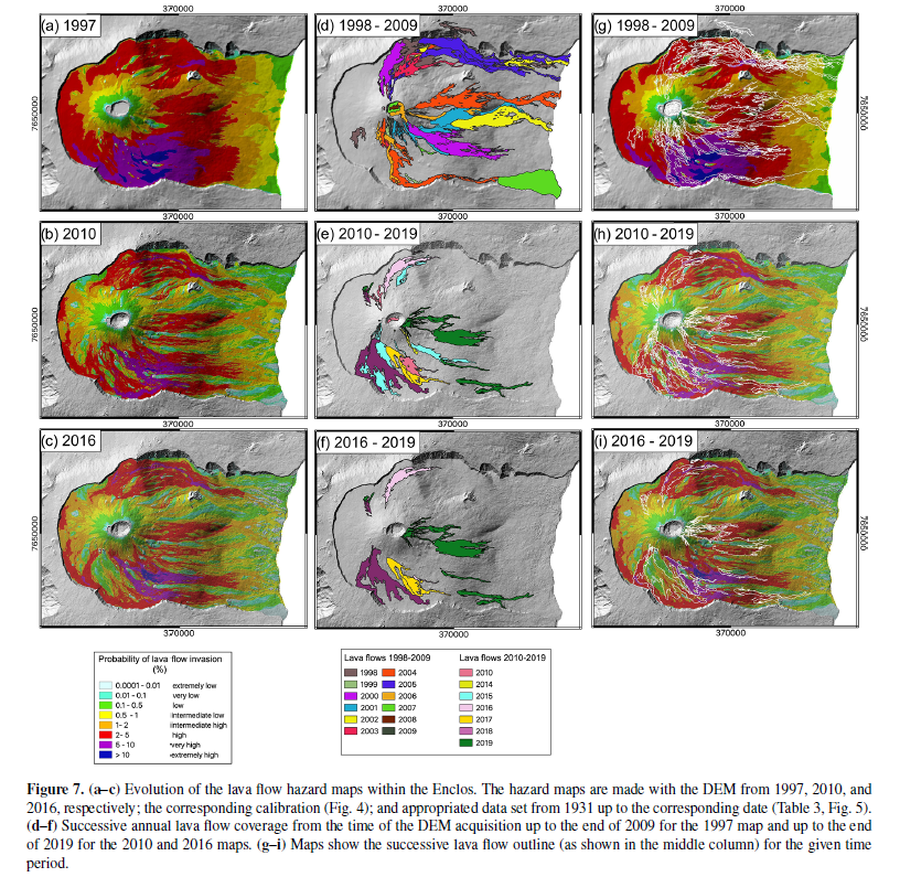
Figure in a journal article
Evolution of the lava flow hazard maps within the Enclos
Figure 7 in: Chevrel, M. O., Favalli, M., Villeneuve, N., Harris, A. J., Fornaciai, A., Richter, N., Derrien, A., Di Muro, A., & Peltier, A. (2021). Lava flow hazard map of Piton de la Fournaise volcano. Natural Hazards and Earth System Sciences, 21(8), 2355-2377. https://doi.org/10.5194/nhess-21-2355-2021, 2021