
Advanced Search for Maps
Showing 51-60 of 372
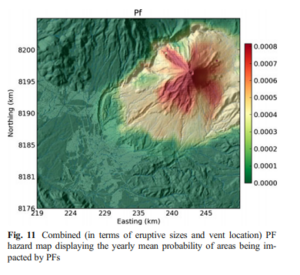
Figure in a journal article
Combined (in terms of eruptive sizes and vent location) PF hazard map displaying the yearly mean probability of areas being impacted by PFs
Figure 11 in: Sandri, L., Thouret, J. C., Constantinescu, R., Biass, S., & Tonini, R. (2014). Long-term multi-hazard assessment for El Misti volcano (Peru). Bulletin of volcanology, 76(2), 771. https://doi.org/10.1007/s00445-013-0771-9
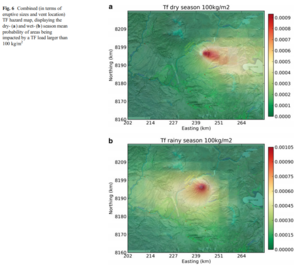
Figure in a journal article
Combined (in terms of eruptive sizes and vent location) TF hazard map, displaying the dry- and wet-season mean probability of areas being impacted by a TF load larger than 100 kg/m²
Figure 6 in: Sandri, L., Thouret, J. C., Constantinescu, R., Biass, S., & Tonini, R. (2014). Long-term multi-hazard assessment for El Misti volcano (Peru). Bulletin of volcanology, 76(2), 771. https://doi.org/10.1007/s00445-013-0771-9
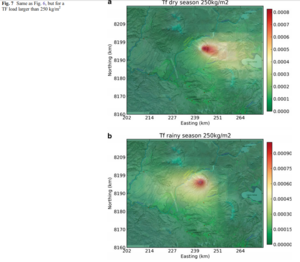
Figure in a journal article
Combined (in terms of eruptive sizes and vent location) TF hazard map, displaying the dry- and wet-season mean probability of areas being impacted by a TF load larger than 250 kg/m²
Figure 7 in: Sandri, L., Thouret, J. C., Constantinescu, R., Biass, S., & Tonini, R. (2014). Long-term multi-hazard assessment for El Misti volcano (Peru). Bulletin of volcanology, 76(2), 771. https://doi.org/10.1007/s00445-013-0771-9
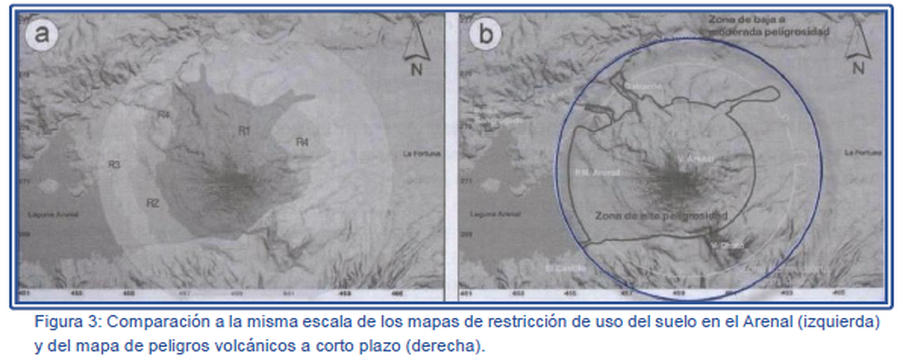
Figure in a journal article
Comparación a la misma escala de los mapas de restricción de uso del suelo en el Arenal (izquierda) y del mapa de peligros volcánicos a corto plazo (derecha).
(Comparison at the same scale of the Arenal land use restriction maps (left) and the short-term volcanic hazard map (right).)
Figure 3 in: Soto, G.J. & Sjöbohm, L. (2007). Los Peligros volcánicos del Arenal. En torno a la Prevencion. Revista No. 4, Junio 2007. Comisión Nacional de Prevención de Riesgos y Atención de Emergencias (CNE).
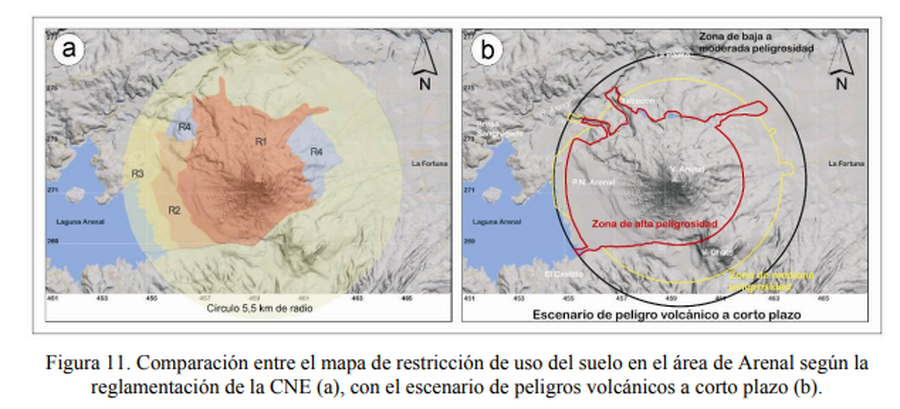
Figure in a journal article
Comparación entre el mapa de restricción de uso del suelo en el área de Arenal según la reglamentación de la CNE, con el escenario de peligros volcánicos a corto plazo.
(Comparison between the land use restriction map in the Arenal area according to CNE regulations, with the short-term volcanic hazard scenario.)
Figure 11 in: Soto, G.J. & Sjöbohm, L. (2005). Sobre el mapeo de los peligros volcánicos del Arenal (Costa Rica) como una herramienta para la planificación del uso del suelo y la mitigación de desastres. Memoria VIII Seminario de Ingeniería Estructural y Sísmica, San José, Costa Rica, Septiembre 2005, 26 p.
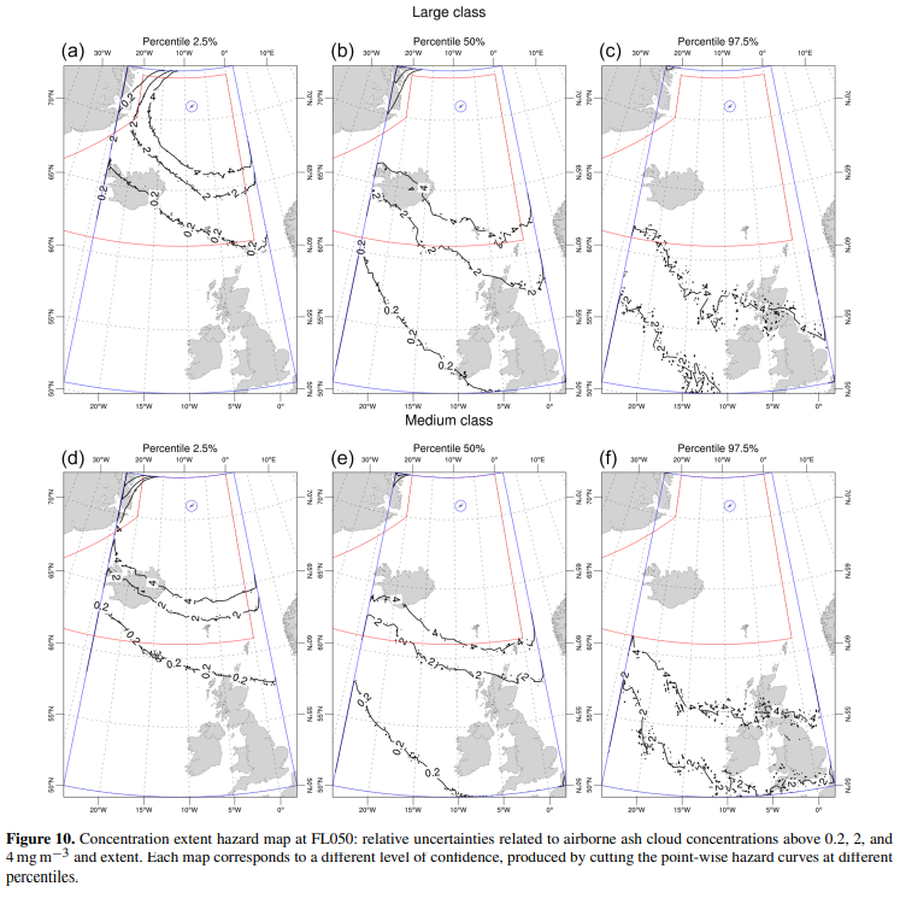
Official, Figure in a journal article
Concentration extent hazard map at FL050
Figure 10 in: Titos, M., Martínez Montesinos, B., Barsotti, S., Sandri, L., Folch, A., Mingari, L., Macedonio, G. & Costa, A. (2022). Long-term hazard assessment of explosive eruptions at Jan Mayen (Norway) and implications for air traffic in the North Atlantic. Natural Hazards and Earth System Sciences, 22(1), 139-163. https://doi.org/10.5194/nhess-22-139-2022
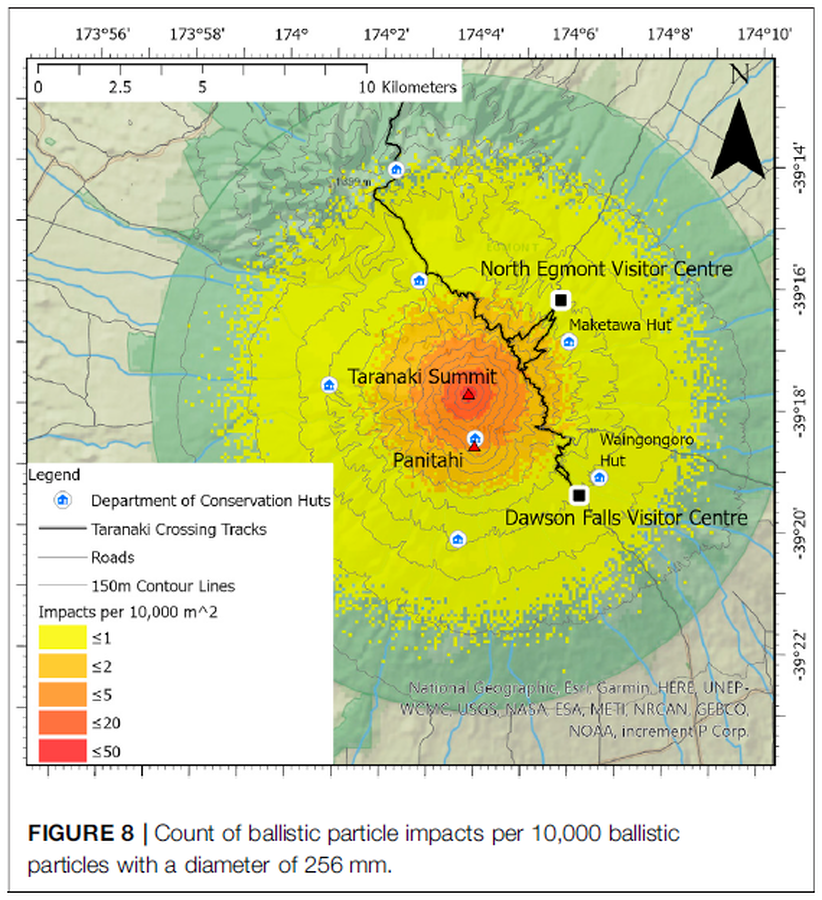
Figure in a journal article
Count of ballistic particle impacts per 10,000 ballistic particles with a diameter of 256 mm
Figure 8 in: Mead, S., Procter, J., Bebbington, M., & Rodriguez-Gomez, C. (2022). Probabilistic Volcanic Hazard Assessment for National Park Infrastructure Proximal to Taranaki Volcano (New Zealand). Frontiers in Earth Science, 435. https://doi.org/10.3389/feart.2022.832531
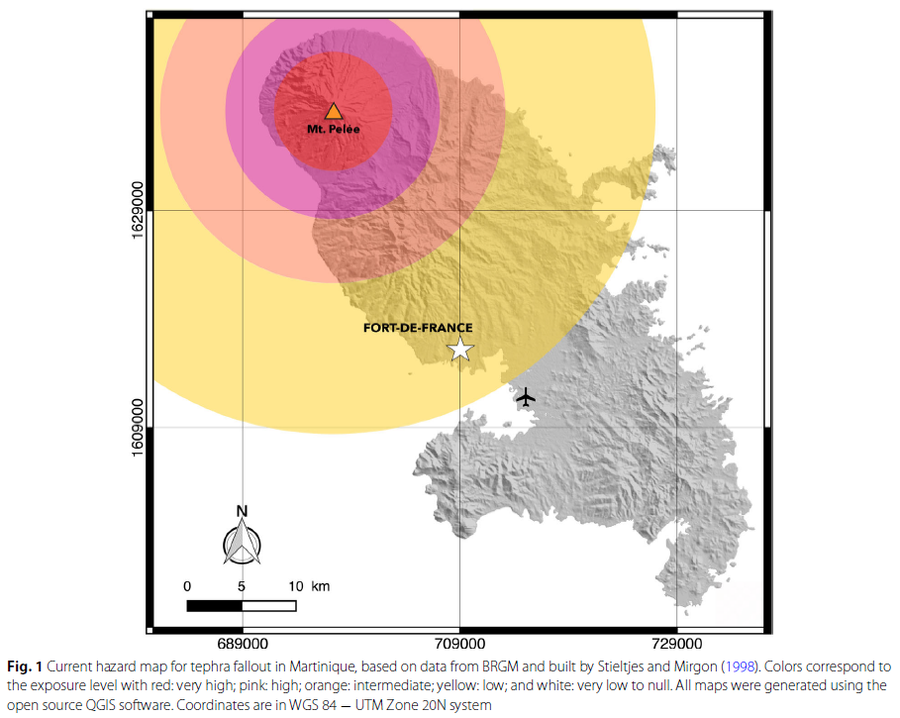
Figure in a journal article
Current hazard map for tephra fallout in Martinique
Figure 1 in: Michaud-Dubuy, A., Carazzo, G., & Kaminski, E. (2021). Volcanic hazard assessment for tephra fallout in Martinique. Journal of Applied Volcanology, 10(1), 1-20. https://doi.org/10.1186/s13617-021-00106-7. (Modified from: Stieltjes & Mirgon 1998)
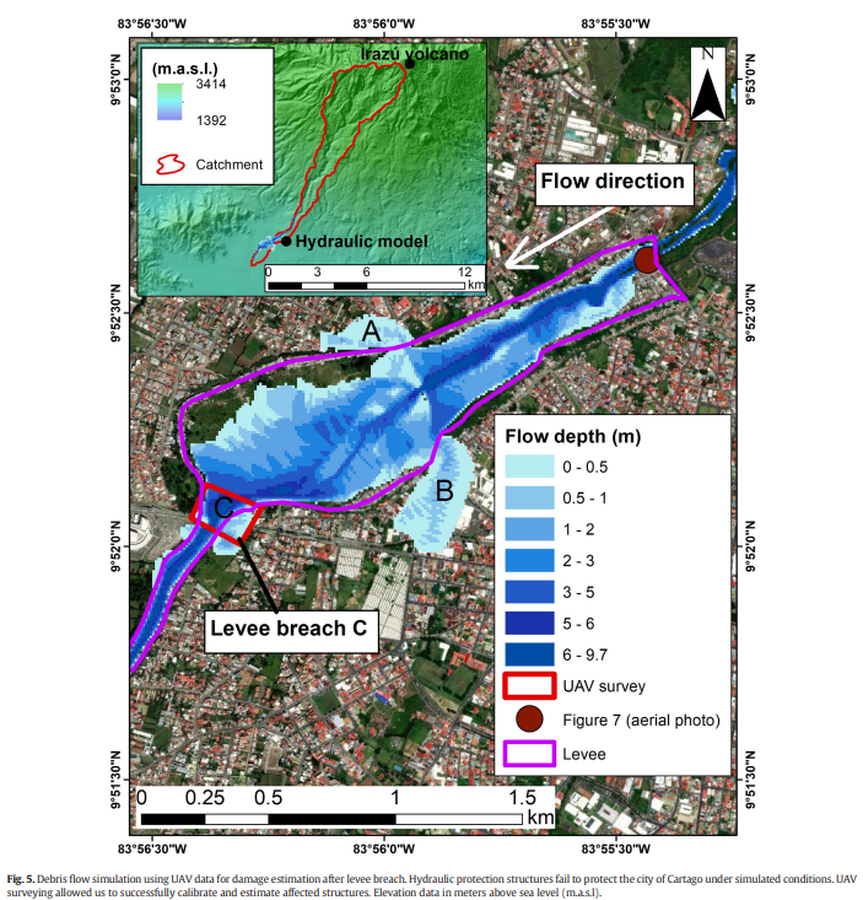
Figure in a journal article
Debris flow simulation using UAV data for damage estimation after levee breach
Figure 5 in: Granados-Bolaños, S., Quesada-Román, A., & Alvarado, G. E. (2021). Low-cost UAV applications in dynamic tropical volcanic landforms. Journal of Volcanology and Geothermal Research, 410, 107143.

Figure in a journal article
Delineation of impact areas for three VBP diameters ejected during the scenario of a hydrothermal eruption at the Hsiaoyiokeng fumarole
Figure 6 in: Nurmawati, A., & Konstantinou, K. I. (2018). Hazard assessment of volcanic ballistic impacts at Mt Chihshin, Tatun Volcano Group, northern Taiwan. Natural hazards, 92(1), p. 77-92. https://doi.org/10.1007/s11069-018-3192-4