
Advanced Search for Maps
Showing 21-30 of 220
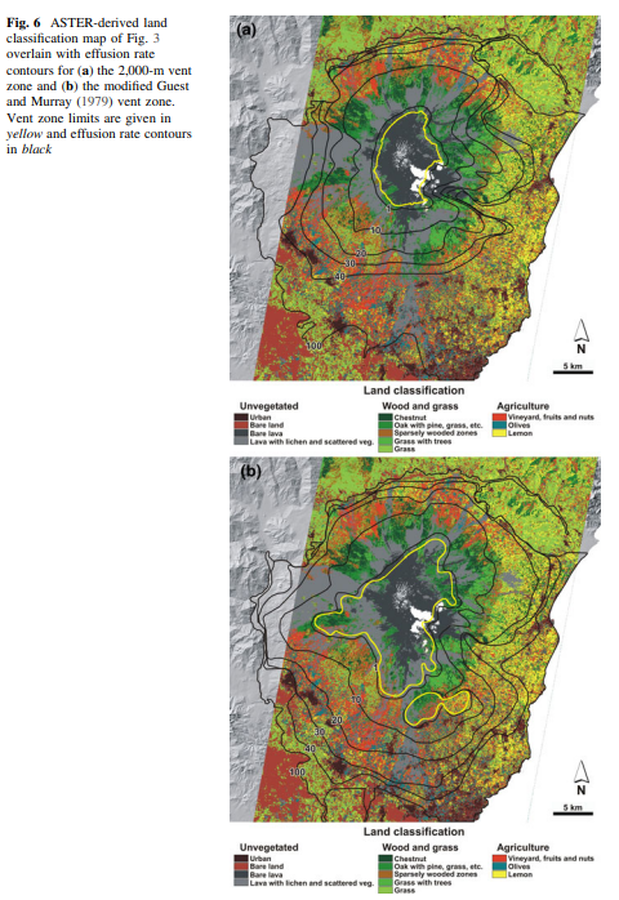
Figure in a journal article
ASTER-derived land classification map of Fig. 3 overlain with effusion rate contours for the 2,000-m vent zone and the modified Guest and Murray (1979) vent zone
Figure 6 in: Harris, A. J., Favalli, M., Wright, R., & Garbeil, H. (2011). Hazard assessment at Mount Etna using a hybrid lava flow inundation model and satellite-based land classification. Natural Hazards, 58(3), 1001-1027. https://doi.org/10.1007/s11069-010-9709-0
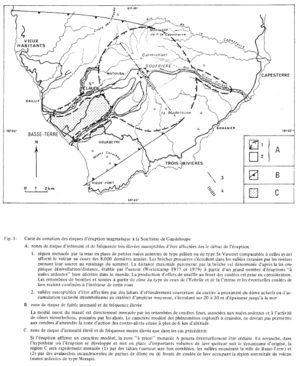
Figure in a journal article
Carte de zonation des risques d'éruption magmatique à la Soufrière de Guadeloupe
(Zonation map of magmatic eruption risks at Soufrière in Guadeloupe)
Figure 5 in: Westercamp, D. (1981). Cartographie du risque volcanique a la soufriere de guadeloupe: Retrospective et tendance actuelle. Bulletin of the International Association of Engineering Geology-Bulletin de l'Association Internationale de Géologie de l'Ingénieur, 23(1), p. 25-32. https://doi.org/10.1007/BF02594723
Official, Insert/poster-size map with accompanying report
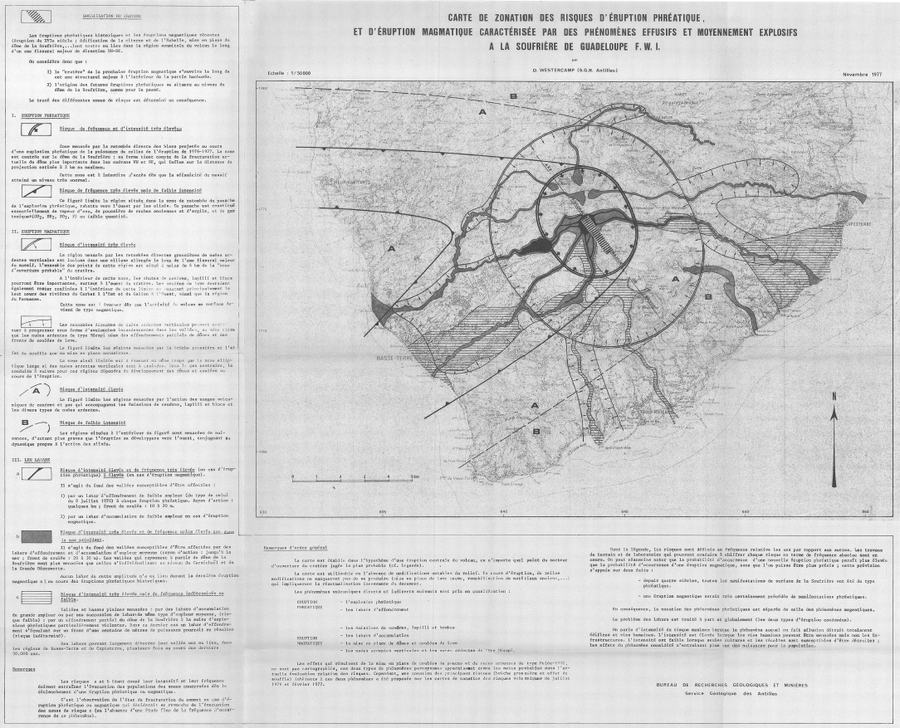
Carte de Zonation des Risques d'Éruption Phréatique, et d'Éruption Magmatique Caractérisée par des Phénomènes Effusifs et Moyennement Explosifs à la Soufrière de Guadeloupe F.W.I.
(Map of Risk of Phreatic Eruption, and Magmatic Eruption Characterized by Effusive and Moderately Explosive Phenomena at Soufrière de Guadeloupe F.W.I.)
Insert in: Westercamp, D. (1977) Levés géologiques, évaluation et zonation des risques volcaniques à la Soufrière de Guadeloupe F. W. I. (Rapport de mission) Mai-Juin 1977. Délégation Générale a la Recherche Scientifique et Technique. 77 Ant 29
Official, Figure in hazard assessment
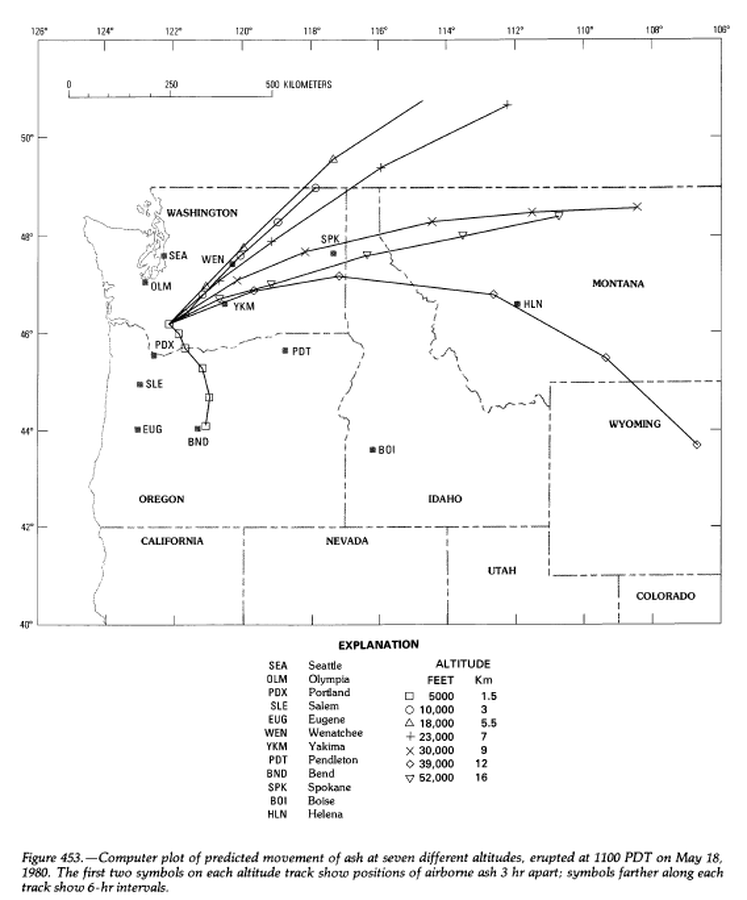
Computer plot of predicted movement of ash at seven different altitudes, erupted at 1100 PDT on May 18, 1980.
Figure 453 in: Miller, C.D., Mullineaux, D.R. & Crandell, D.R. (1981). Hazards assessments at Mount St. Helens. In: Lipman, P. W. & Mullineaux, D. R. (Eds.) The 1980 eruptions of Mount St. Helens, Washington. U.S. Geological Survey, Professional Paper 1250, p. 789-802. https://doi.org/10.3133/pp1250
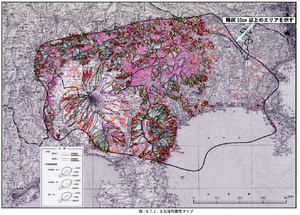
Official, Figure in hazard assessment
Debris flow possibility map
Figure 5.7.1 in: Mt. Fuji Hazard Map Review Committee. (2004). Mt. Fuji Hazard Map Review Committee Report. June 2004. https://www.bousai.go.jp/kazan/fuji_map/pdf/report_200406.pdf
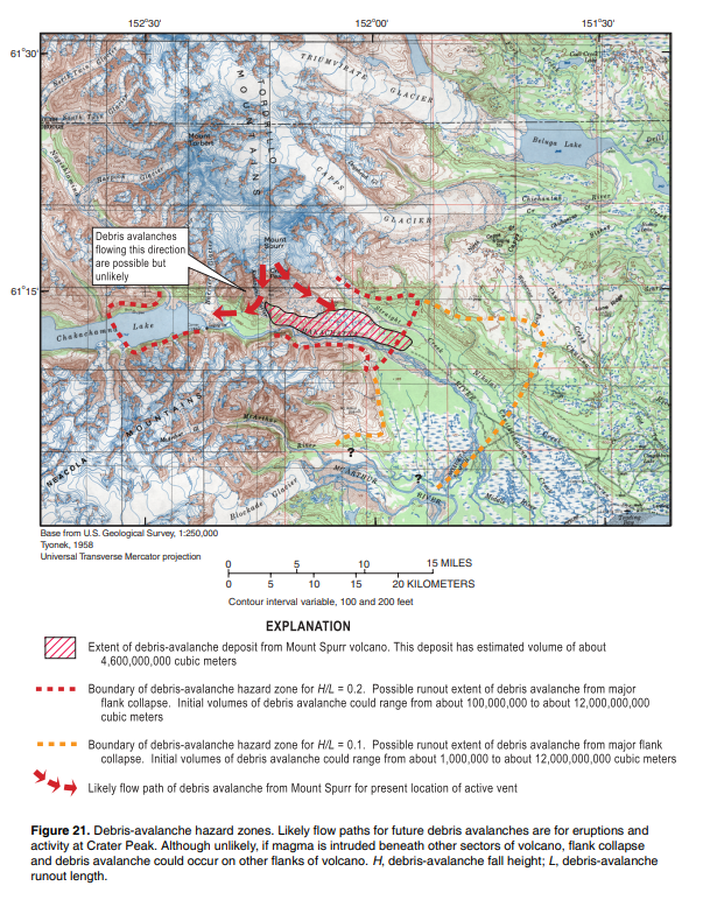
Official, Figure in hazard assessment
Debris-avalanche hazard zone
Figure 21 in: Waythomas, C.F. & Nye, C.J. (2002). Preliminary volcano-hazard assessment for Mount Spurr Volcano, Alaska. U.S. Geological Survey, Open-File Report 2001-482, 40 p., 1 plate. https://doi.org/10.3133/ofr01482

Figure in a journal article
Delineation of impact areas for three VBP diameters ejected during the scenario of a hydrothermal eruption at the Hsiaoyiokeng fumarole
Figure 6 in: Nurmawati, A., & Konstantinou, K. I. (2018). Hazard assessment of volcanic ballistic impacts at Mt Chihshin, Tatun Volcano Group, northern Taiwan. Natural hazards, 92(1), p. 77-92. https://doi.org/10.1007/s11069-018-3192-4
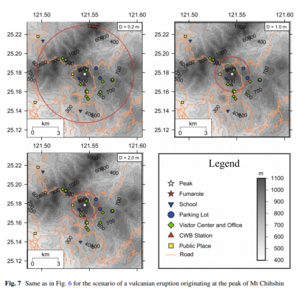
Figure in a journal article
Delineation of impact areas for three VBP diameters ejected during the scenario of a vulcanian eruption originating at the peak of Mt Chihshin
Figure 7 in: Nurmawati, A., & Konstantinou, K. I. (2018). Hazard assessment of volcanic ballistic impacts at Mt Chihshin, Tatun Volcano Group, northern Taiwan. Natural hazards, 92(1), p. 77-92. https://doi.org/10.1007/s11069-018-3192-4
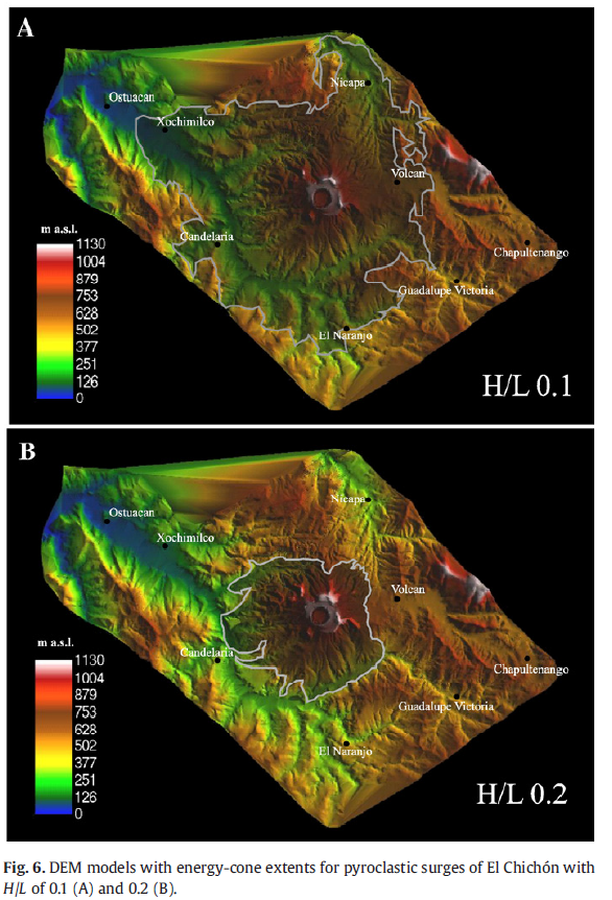
Figure in a journal article
DEM models with energy-cone extents for pyroclastic surges of El Chichón with H/L of 0.1 (A) and 0.2 (B).
Figure 6 in: Macías, J. L., Capra, L., Arce, J. L., Espíndola, J. M., García-Palomo, A., & Sheridan, M. F. (2008). Hazard map of El Chichón volcano, Chiapas, México: Constraints posed by eruptive history and computer simulations. Journal of Volcanology and Geothermal Research, 175(4), 444-458. https://doi.org/10.1016/j.jvolgeores.2008.02.023
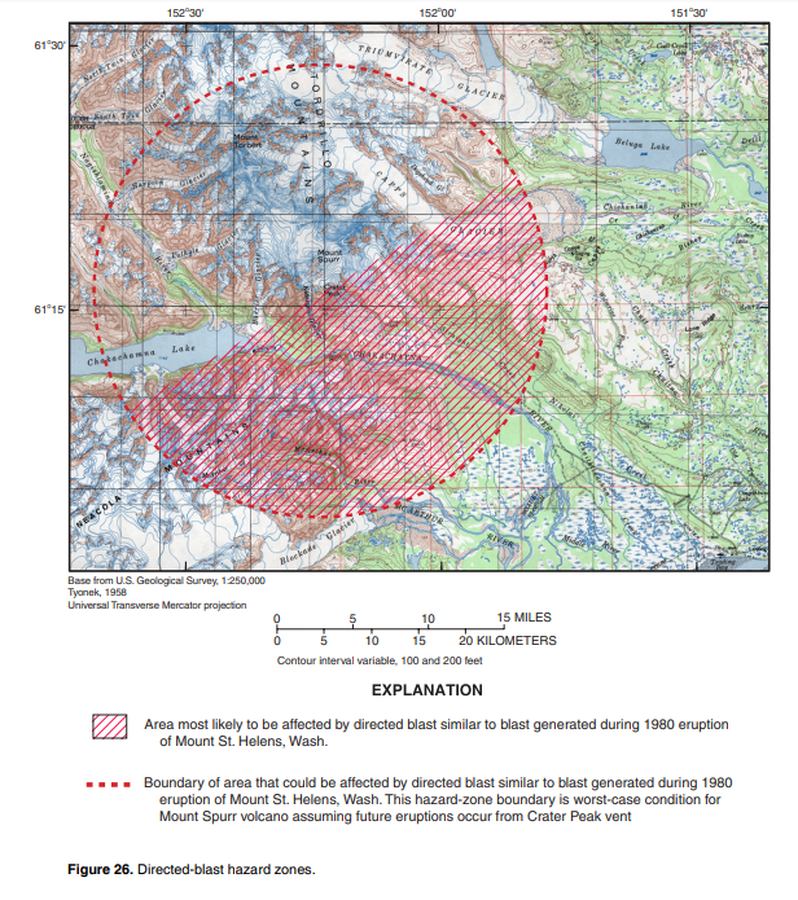
Official, Figure in hazard assessment
Directed-blast hazard zones
Figure 26 in: Waythomas, C.F. & Nye, C.J. (2002). Preliminary volcano-hazard assessment for Mount Spurr Volcano, Alaska. U.S. Geological Survey, Open-File Report 2001-482, 40 p., 1 plate. https://doi.org/10.3133/ofr01482