
Advanced Search for Maps
Showing 41-50 of 220
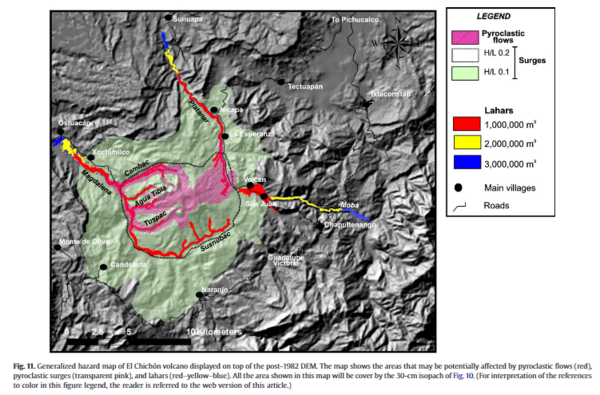
Figure in a journal article
Generalized hazard map of El Chichón volcano displayed on top of the post-1982 DEM
Figure 11 in: Macías, J. L., Capra, L., Arce, J. L., Espíndola, J. M., García-Palomo, A., & Sheridan, M. F. (2008). Hazard map of El Chichón volcano, Chiapas, México: Constraints posed by eruptive history and computer simulations. Journal of Volcanology and Geothermal Research, 175(4), 444-458. https://doi.org/10.1016/j.jvolgeores.2008.02.023
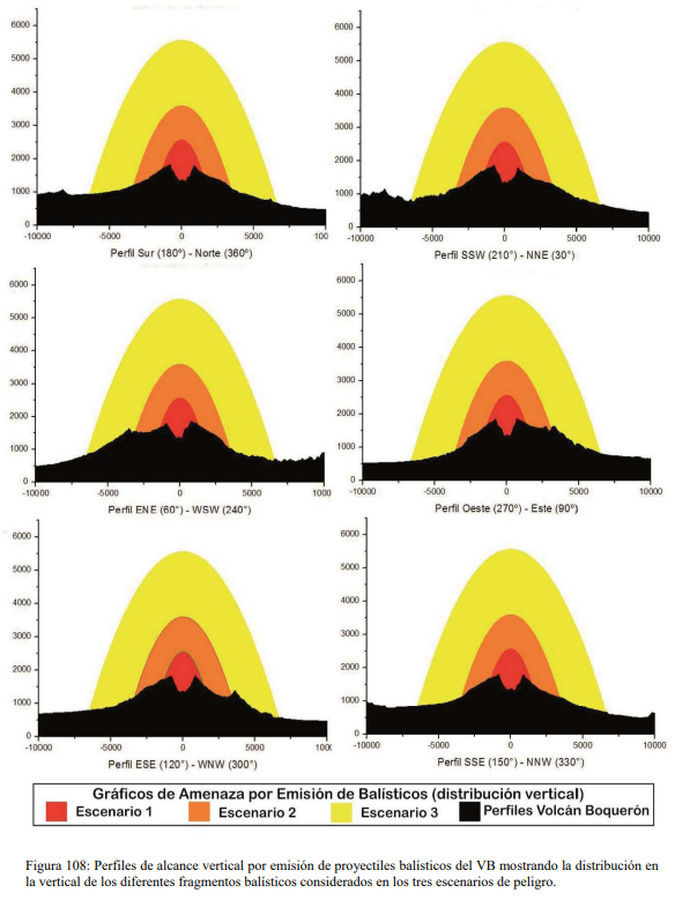
Figure in a thesis or dissertation
Gráficos de Amenaza por Emisión de Balísticos (distribución vertical)
(Ballistic Emission Threat Charts (vertical distribution))
Figure 108 in: Ferrés López, M.D. (2014). Estratigrafía, Geología y Evaluación de Peligros Volcánicos del Complejo Volcánico de San Salvador (El Salvador). Doctoral Thesis, Universidad Autónoma de México, México.
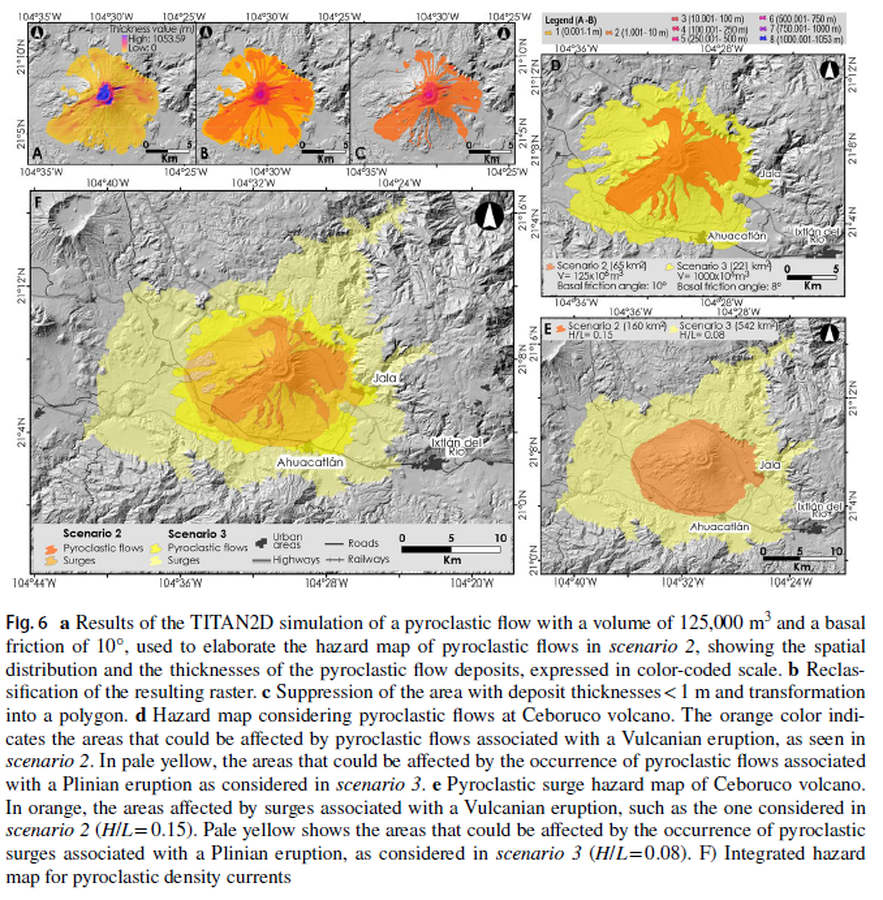
Figure in a journal article
Hazard map considering pyroclastic flows at Ceboruco volcano
Figure 6 in: Sieron, K., Ferrés, D., Siebe, C., Constantinescu, R., Capra, L., Connor, C., Connor, L., Groppelli, G. & Zuccolotto, K.G. (2019). Ceboruco hazard map: part II—modeling volcanic phenomena and construction of the general hazard map. Natural Hazards, 96(2), p. 893-933. https://doi.org/10.1007/s11069-019-03577-5
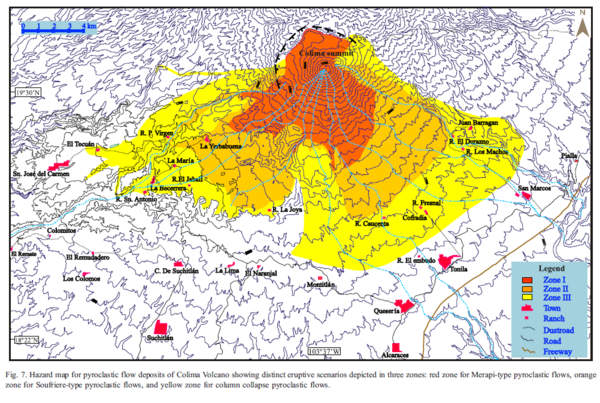
Figure in a journal article
Hazard map for pyroclastic flow deposits of Colima Volcano showing distinct eruptive scenarios depicted in three zones.
Figure 7 in: Saucedo, R., Macías, J.L., Sheridan, M.F., Bursik, M.I., & Komorowski, J.-C. (2005). Modeling of pyroclastic flows of Colima Volcano, Mexico: implications for hazard assessment. Journal of Volcanology and Geothermal Research, 139(1-2), p. 103-115. https://doi.org/10.1016/j.jvolgeores.2004.06.019
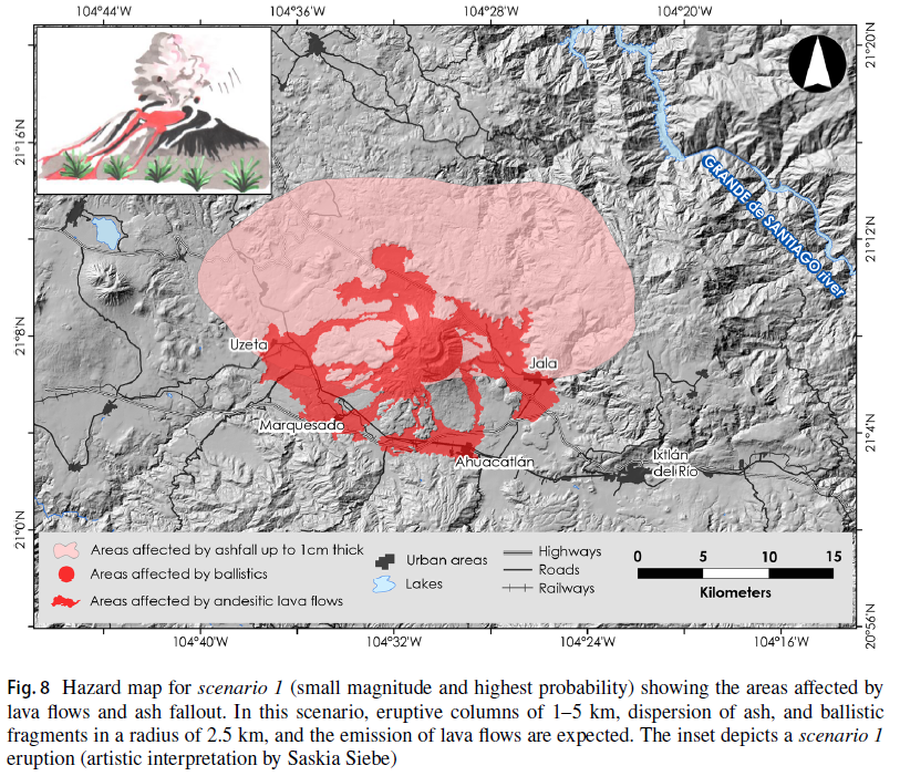
Figure in a journal article
Hazard map for scenario 1 (small magnitude and highest probability) showing the areas affected by lava flows and ash fallout
Figure 8 in: Sieron, K., Ferrés, D., Siebe, C., Constantinescu, R., Capra, L., Connor, C., Connor, L., Groppelli, G. & Zuccolotto, K.G. (2019). Ceboruco hazard map: part II—modeling volcanic phenomena and construction of the general hazard map. Natural Hazards, 96(2), p. 893-933. https://doi.org/10.1007/s11069-019-03577-5
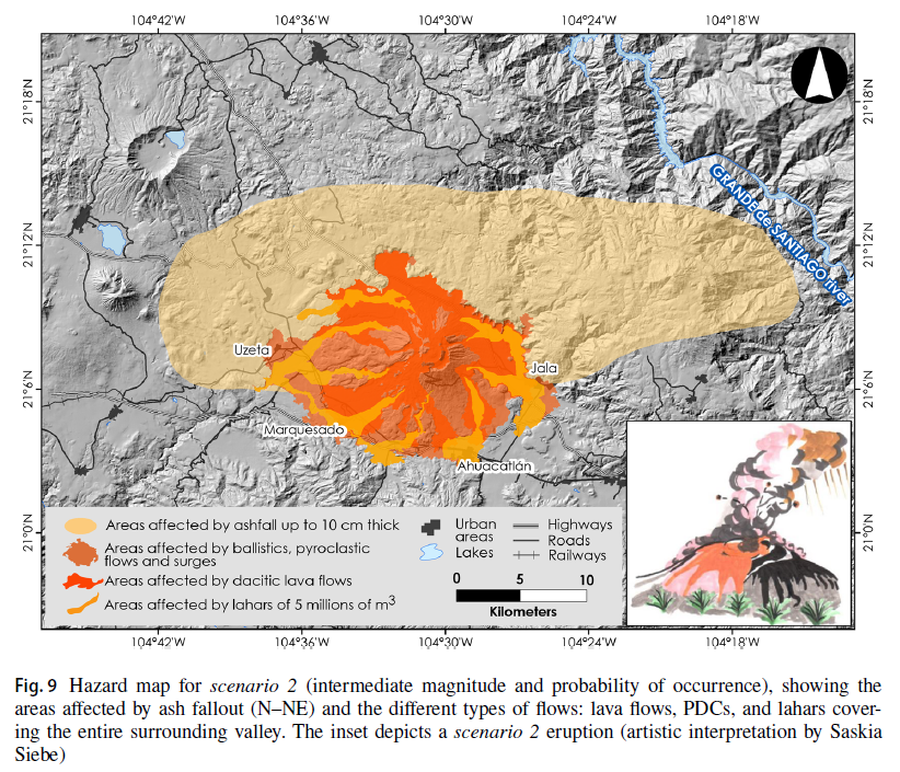
Figure in a journal article
Hazard map for scenario 2 (intermediate magnitude and probability of occurrence), showing the areas affected by ash fallout (N–NE) and the different types of flows: lava flows, PDCs, and lahars covering the entire surrounding valley
Figure 9 in: Sieron, K., Ferrés, D., Siebe, C., Constantinescu, R., Capra, L., Connor, C., Connor, L., Groppelli, G. & Zuccolotto, K.G. (2019). Ceboruco hazard map: part II—modeling volcanic phenomena and construction of the general hazard map. Natural Hazards, 96(2), p. 893-933. https://doi.org/10.1007/s11069-019-03577-5
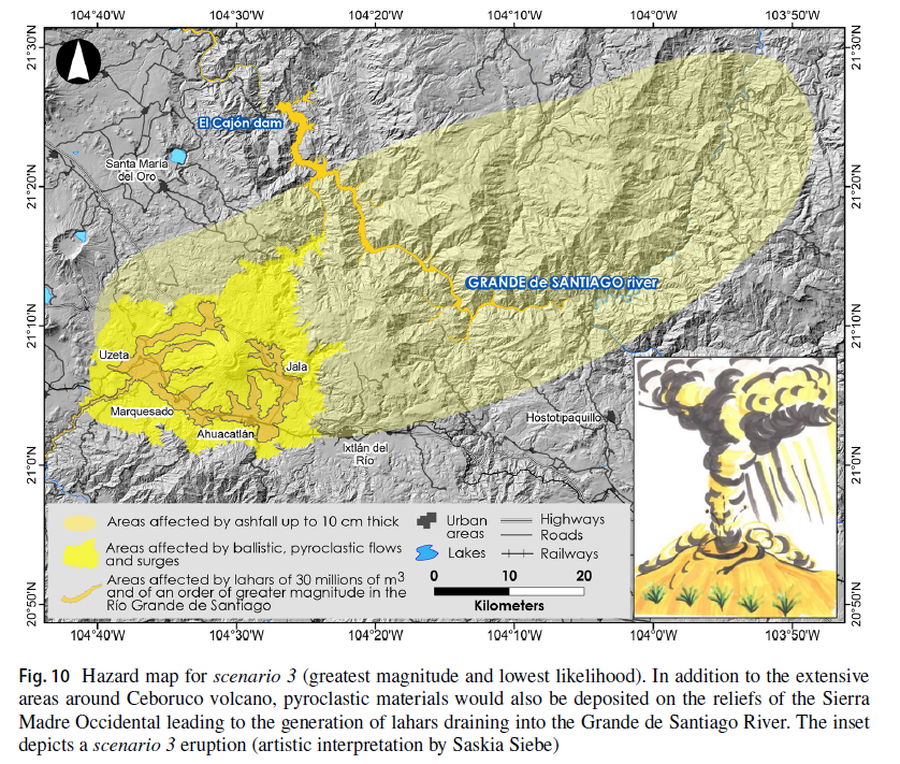
Figure in a journal article
Hazard map for scenario 3 (greatest magnitude and lowest likelihood)
Figure 10 in: Sieron, K., Ferrés, D., Siebe, C., Constantinescu, R., Capra, L., Connor, C., Connor, L., Groppelli, G. & Zuccolotto, K.G. (2019). Ceboruco hazard map: part II—modeling volcanic phenomena and construction of the general hazard map. Natural Hazards, 96(2), p. 893-933. https://doi.org/10.1007/s11069-019-03577-5
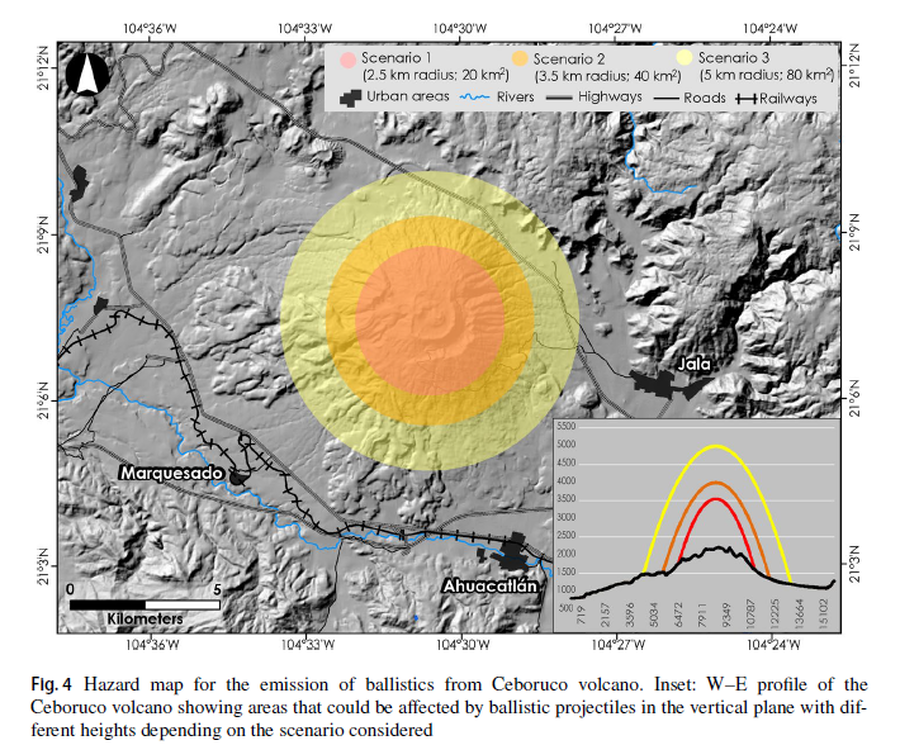
Figure in a journal article
Hazard map for the emission of ballistics from Ceboruco volcano
Figure 4 in: Sieron, K., Ferrés, D., Siebe, C., Constantinescu, R., Capra, L., Connor, C., Connor, L., Groppelli, G. & Zuccolotto, K.G. (2019). Ceboruco hazard map: part II—modeling volcanic phenomena and construction of the general hazard map. Natural Hazards, 96(2), p. 893-933. https://doi.org/10.1007/s11069-019-03577-5
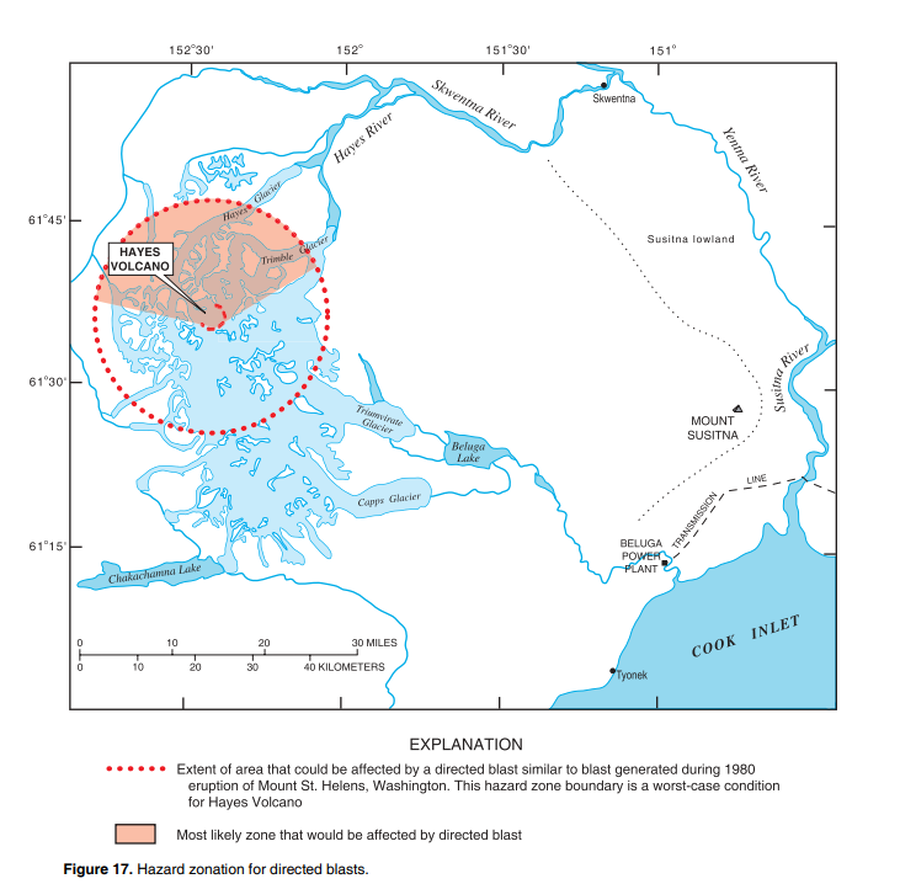
Official, Figure in hazard assessment
Hazard zonation for directed blasts
Figure 17 in: Waythomas, C.F. & Miller, T.P. (2002). Preliminary volcano-hazard assessment for Hayes Volcano, Alaska. U.S. Geological Survey, Open-File Report 02-072, 33 p., 1 plate. https://doi.org/10.3133/ofr0272
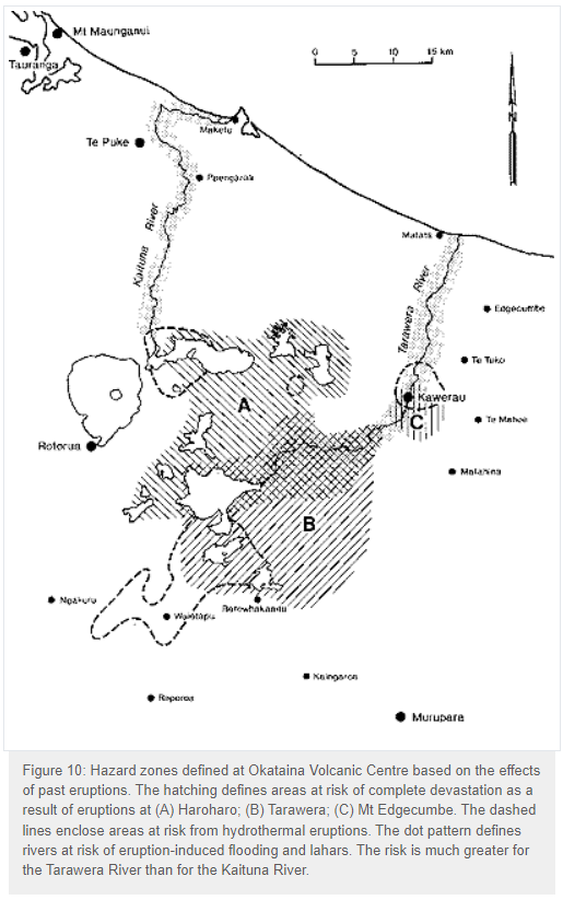
Official, Figure in hazard assessment
Hazard zones defined at Okataina Volcanic Centre based on the effects of past eruptions
Figure 10 in: Nairn, I.A. (1993). Volcanic hazards at Okataina Centre. 3rd ed. Ministry of Civil Defence, Palmerston North, NZ. Volcanic hazards information series 2. 29 p. Reproduced on website: https://www.gns.cri.nz/Home/Learning/Science-Topics/Volcanoes/New-Zealand-Volcanoes/Volcano-Geology-and-Hazards/Okataina-Volcanic-Centre-Geology