
Advanced Search for Maps
Showing 51-60 of 236
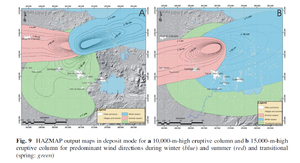
Figure in a journal article
HAZMAP output maps in deposit mode for a 10,000-m-high eruptive column and b 15,000-m-high eruptive column for predominant wind directions during winter (blue) and summer (red) and transitional (spring: green)
Figure 9 in: Sieron, K., Capra, L., & Rodríguez-Elizararrás, S. (2014). Hazard assessment at San Martín volcano based on geological record, numerical modeling, and spatial analysis. Natural hazards, 70(1), 275-297. https://doi.org/10.1007/s11069-013-0807-7
Official, Map in a booklet, long fact-sheet, or handbook
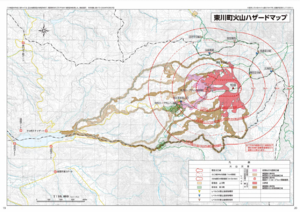
Higashikawa Town Volcano Hazard Map
Higashikawa Town Hall. (2020). Higashikawa Town Disaster Prevention Hazard Map. Hokkaido Map Co., Ltd. 30 p.
Official, Insert/poster-size map with accompanying report
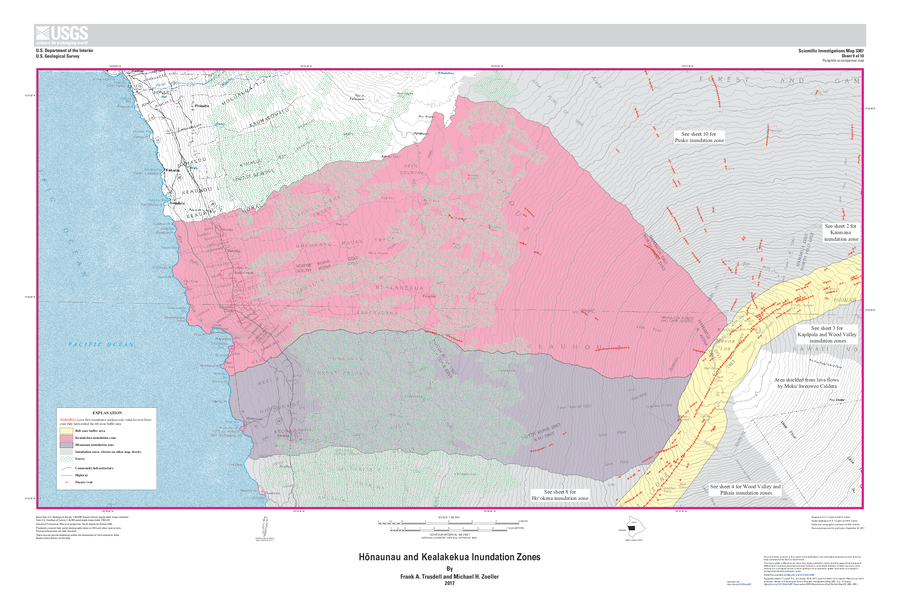
Hōnaunau and Kealakekua Inundation Zones
Sheet 9 in: Trusdell, F.A. & Zoeller, M.H. (2017). Lava inundation zone maps for Mauna Loa, Island of Hawaiʻi, Hawaii. U.S. Geological Survey, Scientific Investigations Map 3387, 12 p., 10 sheets. https://doi.org/10.3133/sim3387
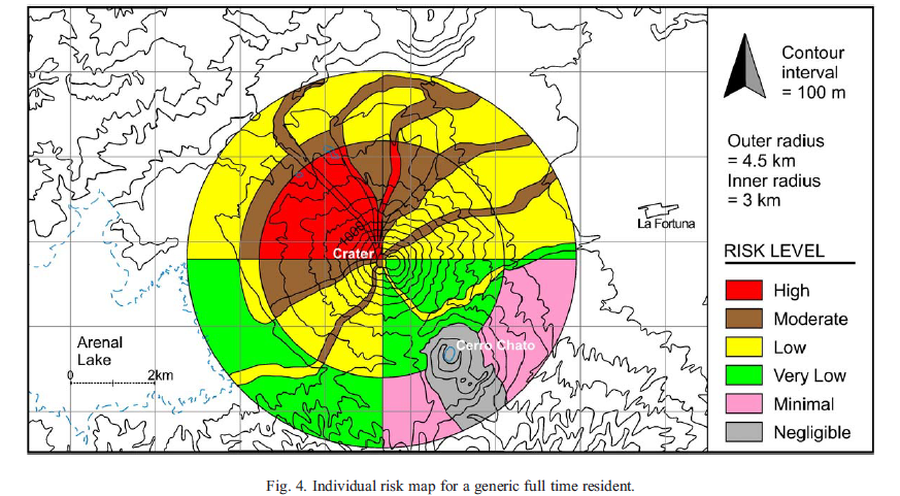
Figure in a journal article
Individual risk map for a generic full time resident
Figure 4 in: Meloy, A.F. (2006). Arenal-type pyroclastic flows: a probabilistic event tree risk analysis. Journal of Volcanology and Geothermal Research, 157(1-3), 121-134. https://doi.org/10.1016/j.jvolgeores.2006.03.048
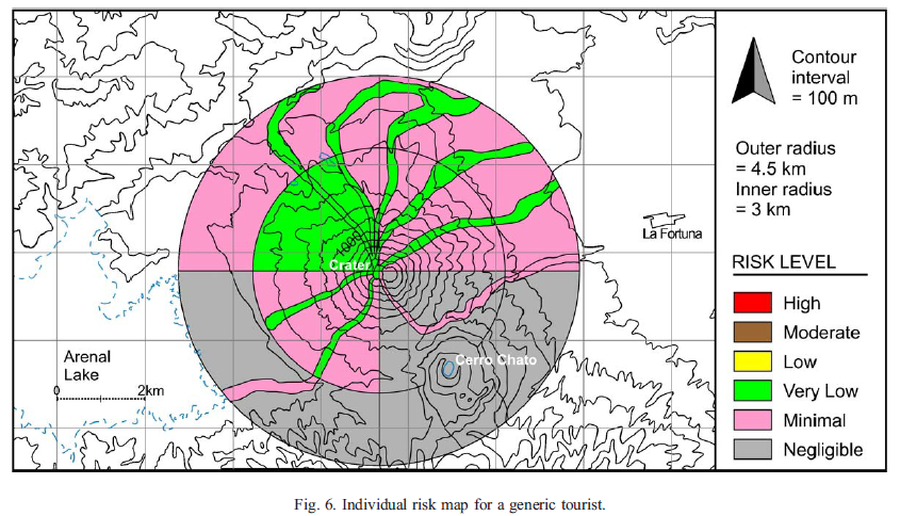
Figure in a journal article
Individual risk map for a generic tourist
Figure 6 in: Meloy, A. F. (2006). Arenal-type pyroclastic flows: a probabilistic event tree risk analysis. Journal of Volcanology and Geothermal Research, 157(1-3), 121-134. https://doi.org/10.1016/j.jvolgeores.2006.03.048
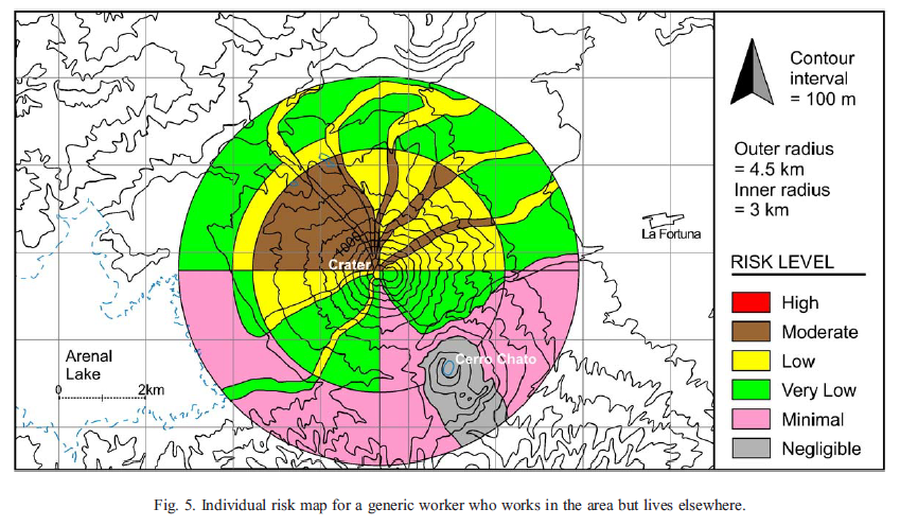
Figure in a journal article
Individual risk map for a generic worker who works in the area but lives elsewhere
Figure 5 in: Meloy, A. F. (2006). Arenal-type pyroclastic flows: a probabilistic event tree risk analysis. Journal of Volcanology and Geothermal Research, 157(1-3), 121-134. https://doi.org/10.1016/j.jvolgeores.2006.03.048
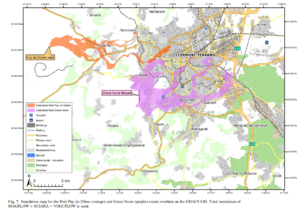
Figure in a journal article
Inundation map for the Petit Puy de Dome (orange) and Grave Noire (purple) events overlain on the GDACS GIS
Figure 7 in: Latutrie, B., Andredakis, I., De Groeve, T., Harris, A. J. L., Langlois, E., de Vries, B. V. W., Saubin, E., Bilotta, G., Cappello, A., Crisci, G.M., D'ambrosio, D., Del Negro, C., Favalli, M., Fujita, E., Iovine, G., Kelfoun, K., Rongo, R., Spataro, W., Tarquini, S., Coppola, D., Ganci, G., Marchese, F., Pergola, N., & Tramutoli, V. (2016). Testing a geographical information system for damage and evacuation assessment during an effusive volcanic crisis. In: Harris, A.J.L., De Groeve, T., & Carn, S.A. (Eds.) Detecting, Modelling and Responding to Effusive Eruptions. Geological Society, London, Special Publications, 426(1), p. 649-672. https://doi.org/10.1144/SP426.19
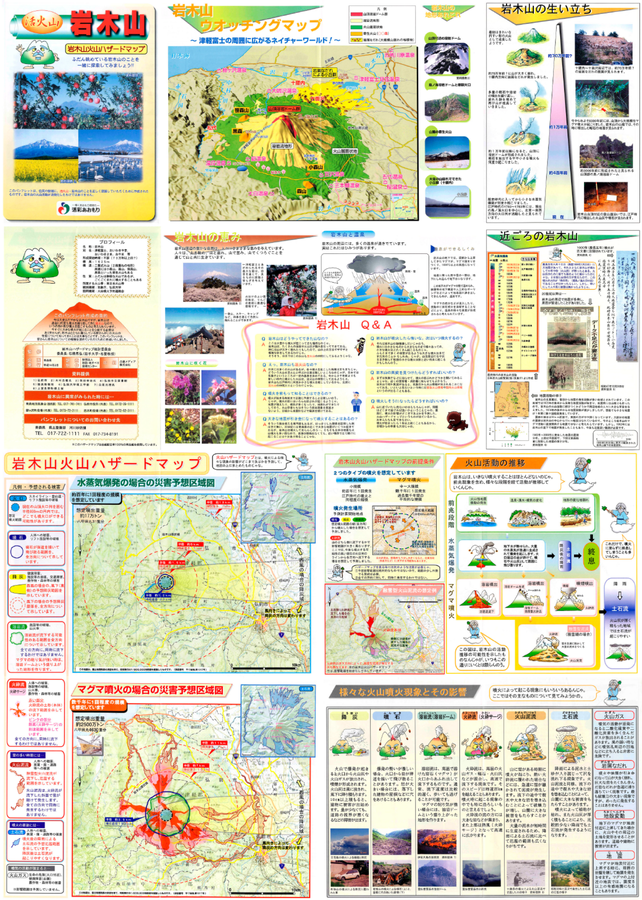
Official, Map sheet or poster
Iwakisan Volcano Hazard Map
Aomori Prefecture. (2002). Active Volcano Iwakisan - Iwakisan Volcanic Hazard Map.
Official, Flyer, brochure, short fact-sheet, or handout
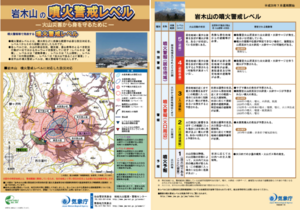
Iwakiyama Volcanic Alert Levels
Japan Meteorological Agency. (2016). Iwakiyama Volcanic Alert Levels. Volcano Monitoring and Warning Center, Volcano Division, Earthquake and Volcano Department.
Official, Flyer, brochure, short fact-sheet, or handout
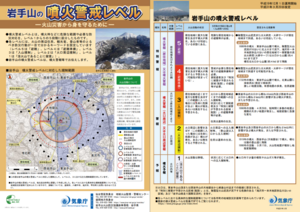
Iwatesan Volcanic Alert Levels
Japan Meteorological Agency. (2019). Iwatesan Volcanic Alert Levels. Volcano Monitoring and Warning Center, Volcano Division, Earthquake and Volcano Department.