
Advanced Search for Maps
Showing 21-30 of 218
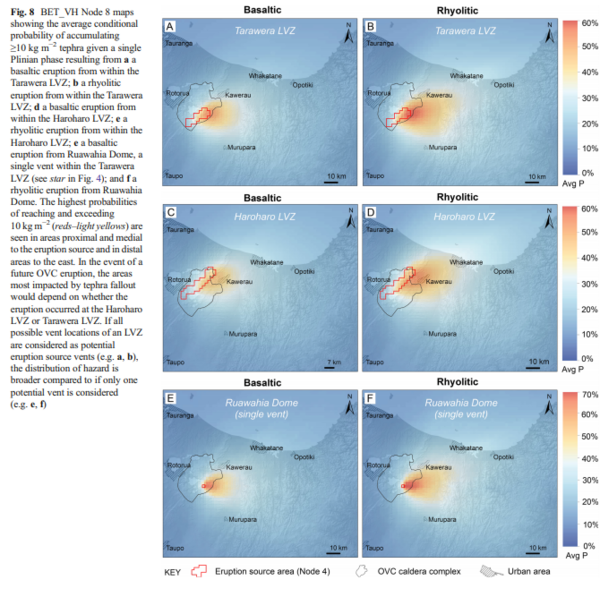
Figure in a journal article
BET_VH Node 8 maps showing the average conditional probability of accumulating ≥10 kg m−2 tephra given a single Plinian phase resulting from a a basaltic eruption from within the Tarawera LVZ; b a rhyolitic eruption from within the Tarawera LVZ; d a basaltic eruption from within the Haroharo LVZ; e a rhyolitic eruption from within the Haroharo LVZ; e a basaltic eruption from Ruawahia Dome, a single vent within the Tarawera LVZ (see star in Fig. 4); and f a rhyolitic eruption from Ruawahia Dome
Figure 8 in: Thompson, M. A., Lindsay, J. M., Sandri, L., Biass, S., Bonadonna, C., Jolly, G., & Marzocchi, W. (2015). Exploring the influence of vent location and eruption style on tephra fall hazard from the Okataina Volcanic Centre, New Zealand. Bulletin of volcanology, 77(5), 38. https://doi.org/10.1007/s00445-015-0926-y
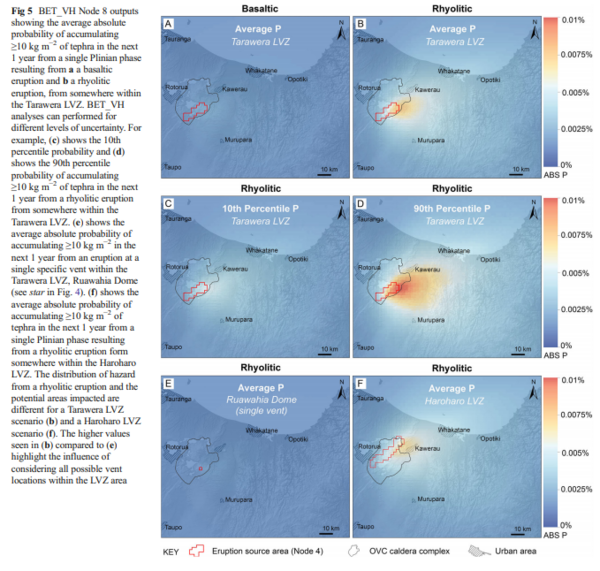
Figure in a journal article
BET_VH Node 8 outputs showing the average absolute probability of accumulating ≥10 kg m−2 of tephra in the next 1 year from a single Plinian phase resulting from a a basaltic eruption and b a rhyolitic eruption, from somewhere within the Tarawera LVZ
Figure 5 in: Thompson, M. A., Lindsay, J. M., Sandri, L., Biass, S., Bonadonna, C., Jolly, G., & Marzocchi, W. (2015). Exploring the influence of vent location and eruption style on tephra fall hazard from the Okataina Volcanic Centre, New Zealand. Bulletin of volcanology, 77(5), 38. https://doi.org/10.1007/s00445-015-0926-y
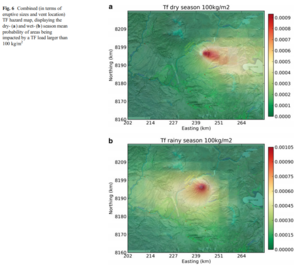
Figure in a journal article
Combined (in terms of eruptive sizes and vent location) TF hazard map, displaying the dry- and wet-season mean probability of areas being impacted by a TF load larger than 100 kg/m²
Figure 6 in: Sandri, L., Thouret, J. C., Constantinescu, R., Biass, S., & Tonini, R. (2014). Long-term multi-hazard assessment for El Misti volcano (Peru). Bulletin of volcanology, 76(2), 771. https://doi.org/10.1007/s00445-013-0771-9
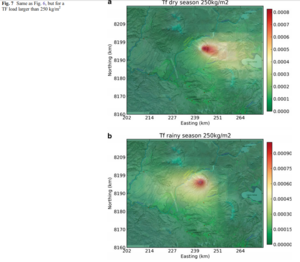
Figure in a journal article
Combined (in terms of eruptive sizes and vent location) TF hazard map, displaying the dry- and wet-season mean probability of areas being impacted by a TF load larger than 250 kg/m²
Figure 7 in: Sandri, L., Thouret, J. C., Constantinescu, R., Biass, S., & Tonini, R. (2014). Long-term multi-hazard assessment for El Misti volcano (Peru). Bulletin of volcanology, 76(2), 771. https://doi.org/10.1007/s00445-013-0771-9
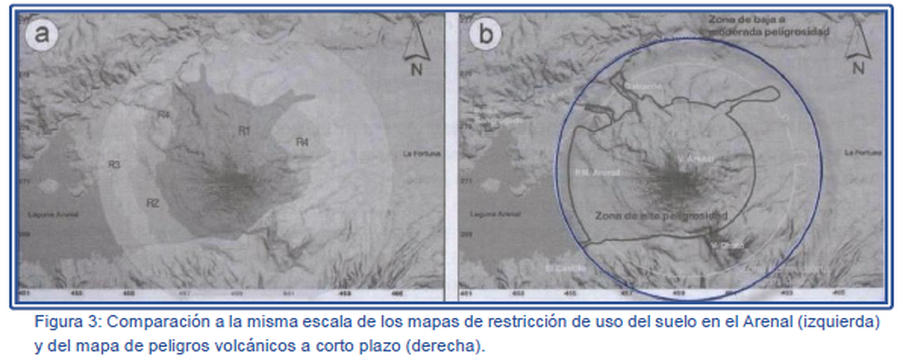
Figure in a journal article
Comparación a la misma escala de los mapas de restricción de uso del suelo en el Arenal (izquierda) y del mapa de peligros volcánicos a corto plazo (derecha).
(Comparison at the same scale of the Arenal land use restriction maps (left) and the short-term volcanic hazard map (right).)
Figure 3 in: Soto, G.J. & Sjöbohm, L. (2007). Los Peligros volcánicos del Arenal. En torno a la Prevencion. Revista No. 4, Junio 2007. Comisión Nacional de Prevención de Riesgos y Atención de Emergencias (CNE).
Official, Figure in hazard assessment
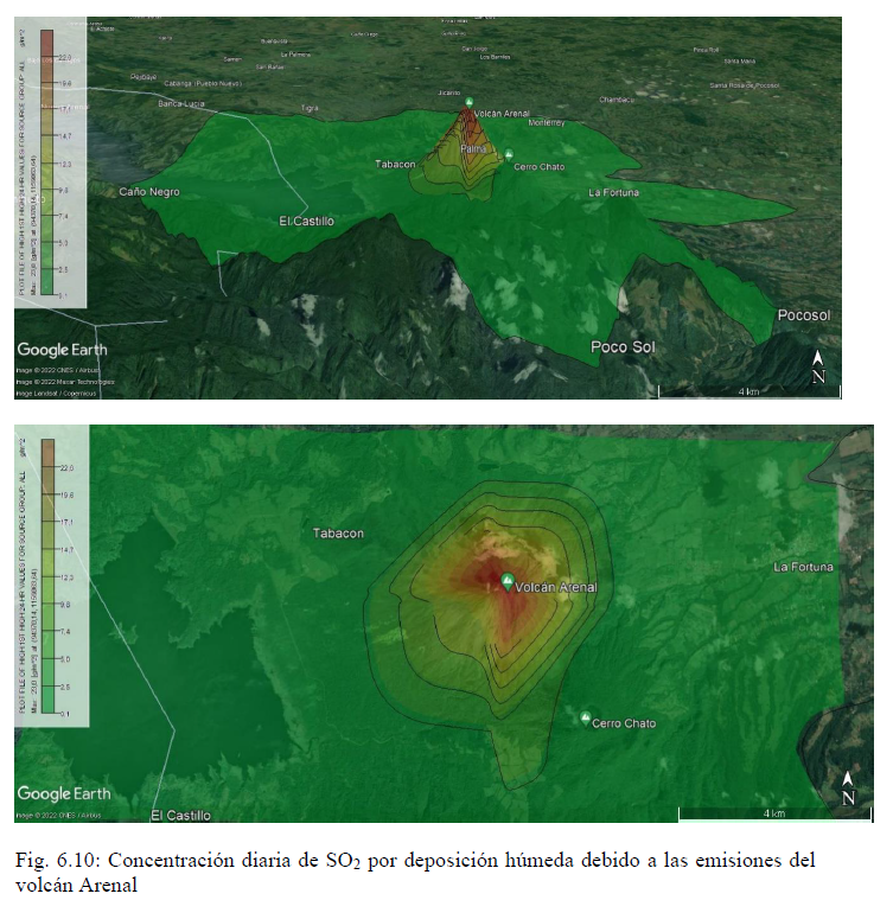
Concentración diaria de SO2 por deposición húmeda debido a las emisiones del volcán Arenal
(Daily SO2 concentration due to wet deposition of emissions from the Arenal volcano)
Figure 6.10 in: Alvarado, G.E., Brenes-André, F., Núñez, D., Borbón, J., Ramírez, M.A., Alpízar, Y., Núñez, S., Sibaja, J.P., Esquivel, L. (2023). Actualización del Análisis del Peligro Volcánico del Arenal, Costa Rica. Instituto Costarricense de Electricidad (ICE). Mayo 2023.
Official, Figure in a journal article
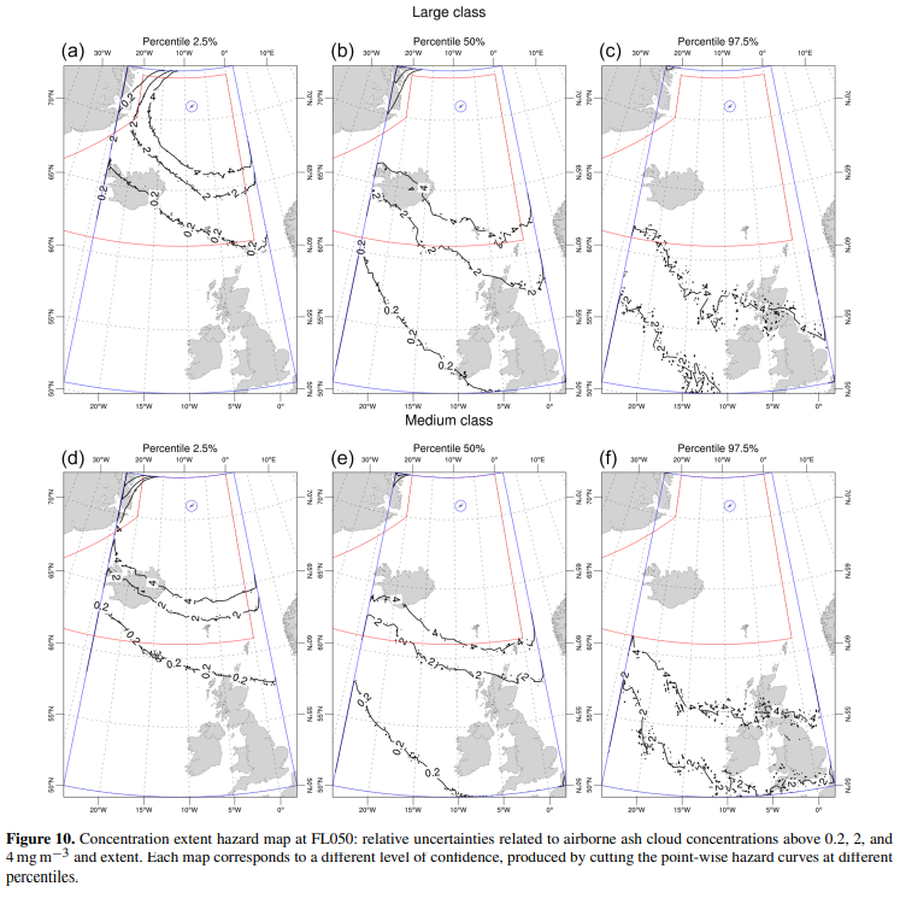
Concentration extent hazard map at FL050
Figure 10 in: Titos, M., Martínez Montesinos, B., Barsotti, S., Sandri, L., Folch, A., Mingari, L., Macedonio, G. & Costa, A. (2022). Long-term hazard assessment of explosive eruptions at Jan Mayen (Norway) and implications for air traffic in the North Atlantic. Natural Hazards and Earth System Sciences, 22(1), 139-163. https://doi.org/10.5194/nhess-22-139-2022

Figure in a journal article
Delineation of impact areas for three VBP diameters ejected during the scenario of a hydrothermal eruption at the Hsiaoyiokeng fumarole
Figure 6 in: Nurmawati, A., & Konstantinou, K. I. (2018). Hazard assessment of volcanic ballistic impacts at Mt Chihshin, Tatun Volcano Group, northern Taiwan. Natural hazards, 92(1), p. 77-92. https://doi.org/10.1007/s11069-018-3192-4
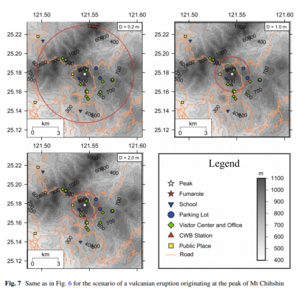
Figure in a journal article
Delineation of impact areas for three VBP diameters ejected during the scenario of a vulcanian eruption originating at the peak of Mt Chihshin
Figure 7 in: Nurmawati, A., & Konstantinou, K. I. (2018). Hazard assessment of volcanic ballistic impacts at Mt Chihshin, Tatun Volcano Group, northern Taiwan. Natural hazards, 92(1), p. 77-92. https://doi.org/10.1007/s11069-018-3192-4
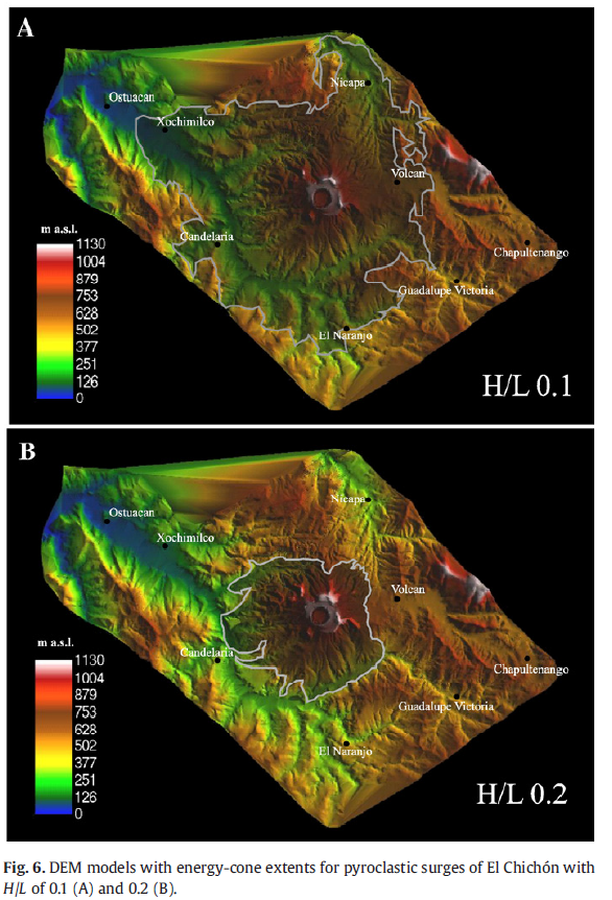
Figure in a journal article
DEM models with energy-cone extents for pyroclastic surges of El Chichón with H/L of 0.1 (A) and 0.2 (B).
Figure 6 in: Macías, J. L., Capra, L., Arce, J. L., Espíndola, J. M., García-Palomo, A., & Sheridan, M. F. (2008). Hazard map of El Chichón volcano, Chiapas, México: Constraints posed by eruptive history and computer simulations. Journal of Volcanology and Geothermal Research, 175(4), 444-458. https://doi.org/10.1016/j.jvolgeores.2008.02.023