
Advanced Search for Maps
Showing 41-50 of 218
Official, Figure in a journal article
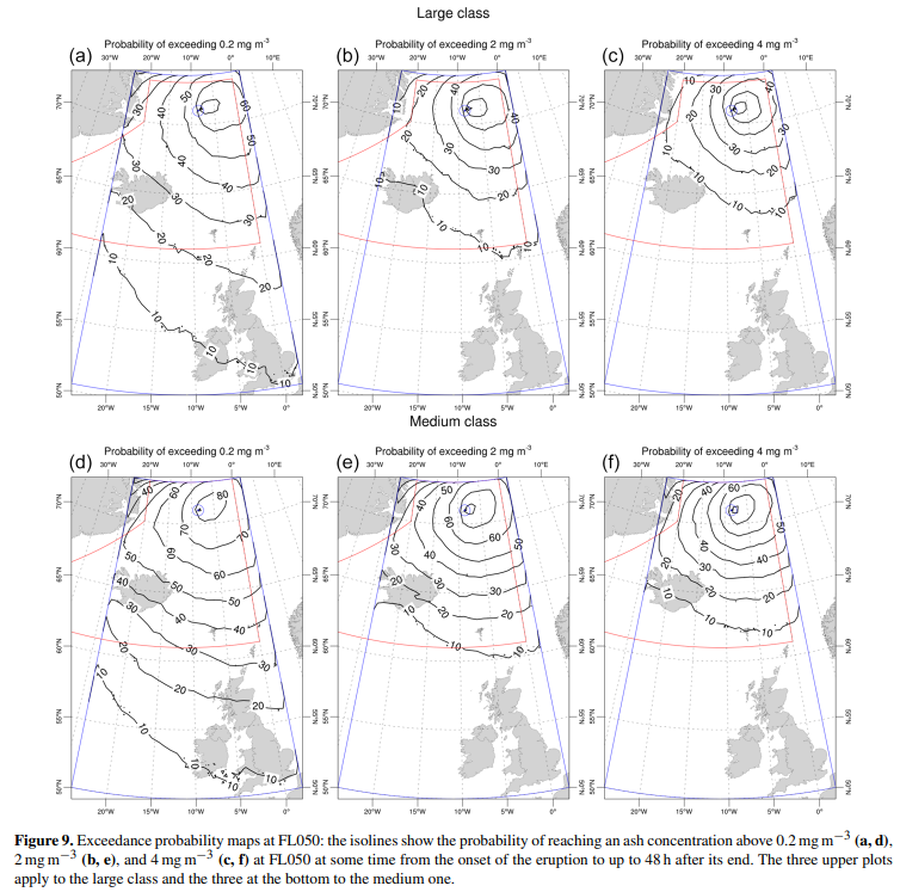
Exceedance probability maps at FL050
Figure 9 in: Titos, M., Martínez Montesinos, B., Barsotti, S., Sandri, L., Folch, A., Mingari, L., Macedonio, G. & Costa, A. (2022). Long-term hazard assessment of explosive eruptions at Jan Mayen (Norway) and implications for air traffic in the North Atlantic. Natural Hazards and Earth System Sciences, 22(1), 139-163. https://doi.org/10.5194/nhess-22-139-2022
Official, Figure in a journal article
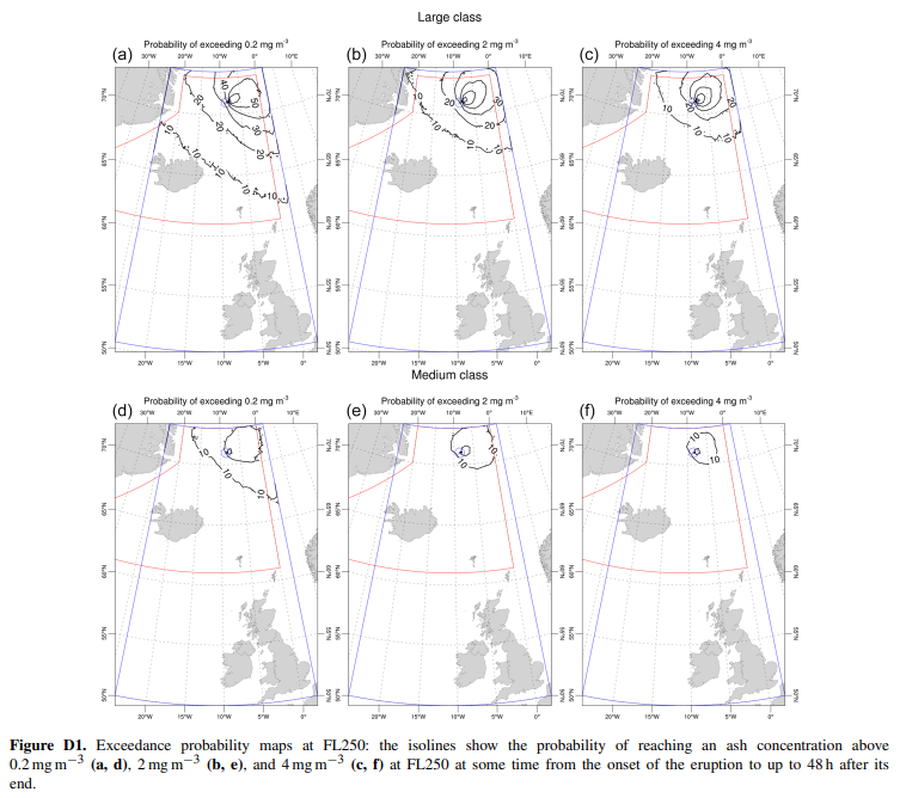
Exceedance probability maps at FL250
Figure D1 in: Titos, M., Martínez Montesinos, B., Barsotti, S., Sandri, L., Folch, A., Mingari, L., Macedonio, G. & Costa, A. (2022). Long-term hazard assessment of explosive eruptions at Jan Mayen (Norway) and implications for air traffic in the North Atlantic. Natural Hazards and Earth System Sciences, 22(1), 139-163. https://doi.org/10.5194/nhess-22-139-2022
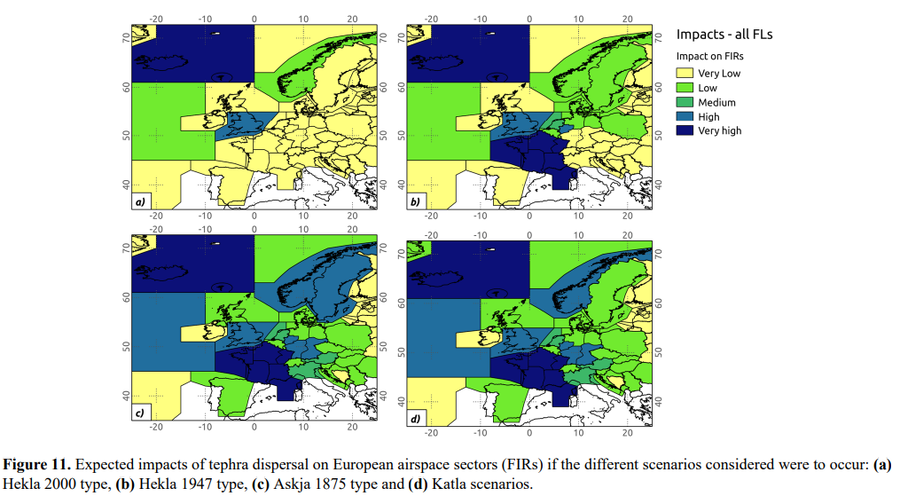
Figure in a journal article
Expected impacts of tephra dispersal on European airspace sectors
Figure 11 in: Scaini, C., Biass, S., Galderisi, A., Bonadonna, C., Folch, A., Smith, K., & Höskuldsson, A. (2014). A multi-scale risk assessment for tephra fallout and airborne concentration from multiple Icelandic volcanoes–Part 2: Vulnerability and impact. Natural hazards and earth system sciences, 14(8), 2289–2312. https://doi.org/10.5194/nhess-14-2289-2014
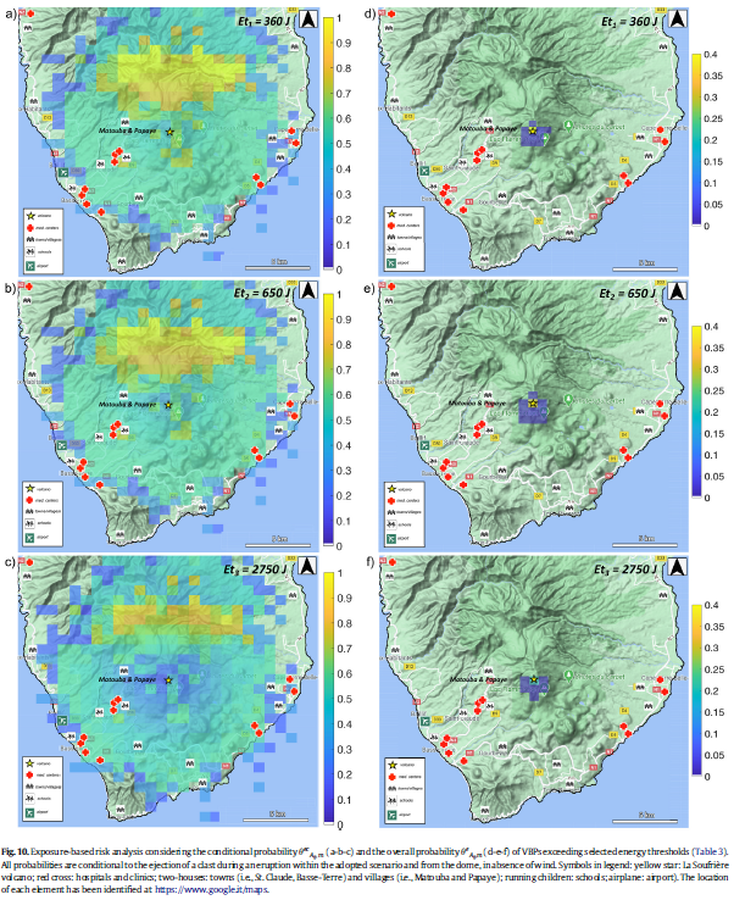
Figure in a journal article
Exposure-based risk analysis considering the conditional probability and the overall probability of VBPs exceeding selected energy thresholds
Figure 10 in: Massaro, S., Rossi, E., Sandri, L., Bonadonna, C., Selva, J., Moretti, R., & Komorowski, J. C. (2022). Assessing hazard and potential impact associated with volcanic ballistic projectiles: The example of La Soufrière de Guadeloupe volcano (Lesser Antilles). Journal of volcanology and geothermal research, 423, 107453. https://doi.org/10.1016/j.jvolgeores.2021.107453
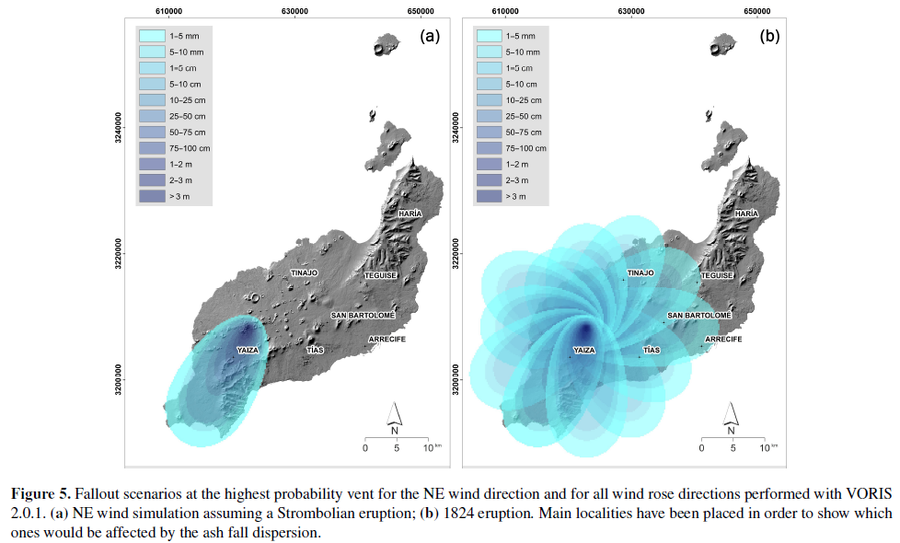
Figure in a journal article
Fallout scenarios at the highest probability vent for the NE wind direction and for all wind rose directions performed with VORIS 2.0.1
Figure 5 in: Becerril, L., Martí, J., Bartolini, S., & Geyer, A. (2017). Assessing qualitative long-term volcanic hazards at Lanzarote Island (Canary Islands). Natural Hazards and Earth System Sciences, 17(7), 1145-1157. https://doi.org/10.5194/nhess-17-1145-2017
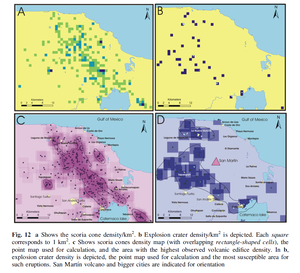
Figure in a journal article
Fig. 12 a Shows the scoria cone density/km². b Explosion crater density/km² is depicted. Each square corresponds to 1 km2. c Shows scoria cones density map (with overlapping rectangle-shaped cells), the point map used for calculation, and the area with the highest observed volcanic edifice density.
Figure 12 in: Sieron, K., Capra, L., & Rodríguez-Elizararrás, S. (2014). Hazard assessment at San Martín volcano based on geological record, numerical modeling, and spatial analysis. Natural hazards, 70(1), 275-297. https://doi.org/10.1007/s11069-013-0807-7
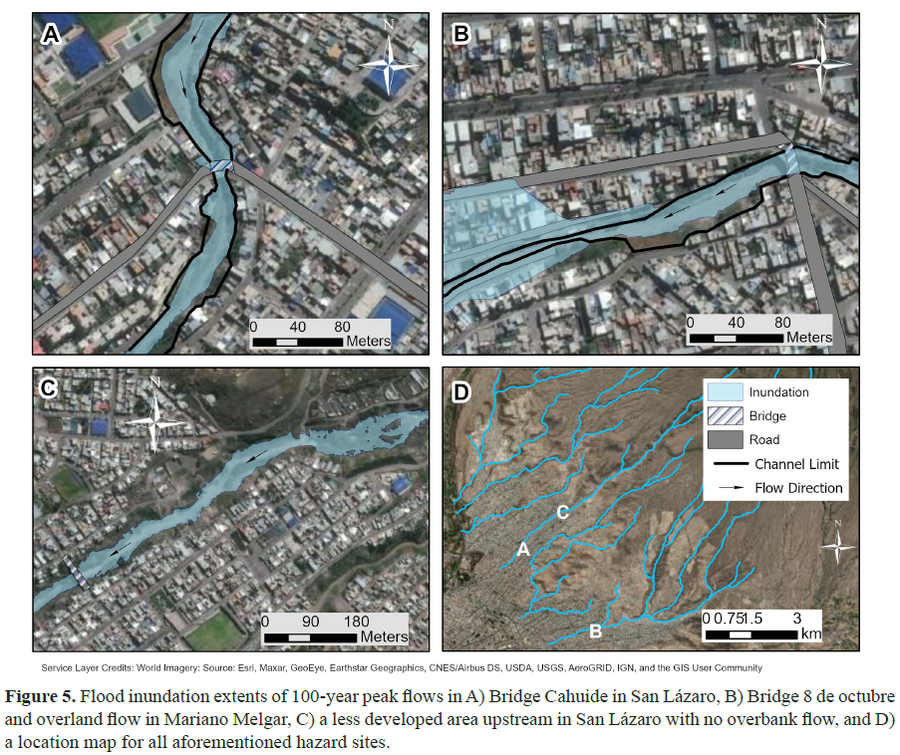
Figure in a journal article
Flood inundation extents of 100-year peak flows
Figure 5 in: Mazer, K. E., Tomasek, A. A., Daneshvar, F., Bowling, L. C., Frankenberger, J. R., McMillan, S. K., Novoa, H.M., & Zeballos‐Velarde, C. (2021). Integrated hydrologic and hydraulic analysis of torrential flood hazard in Arequipa, Peru. Journal of Contemporary Water Research & Education, 171(1), 93-110. https://doi.org/10.1111/j.1936-704X.2020.3347.x
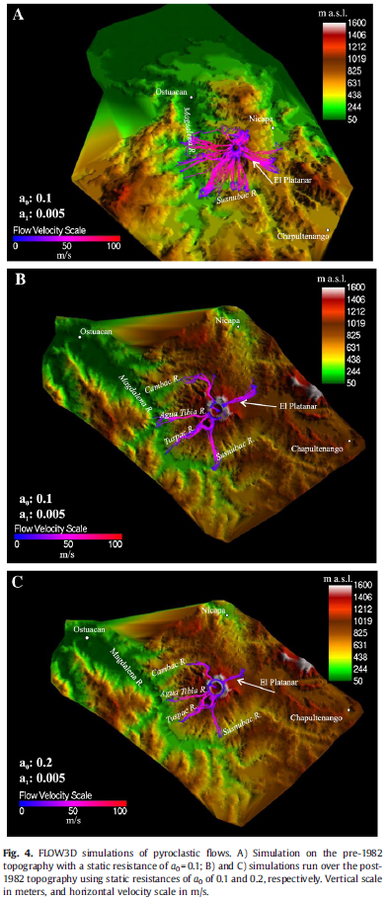
Figure in a journal article
FLOW3D simulations of pyroclastic flows
Figure 4 in: Macías, J. L., Capra, L., Arce, J. L., Espíndola, J. M., García-Palomo, A., & Sheridan, M. F. (2008). Hazard map of El Chichón volcano, Chiapas, México: Constraints posed by eruptive history and computer simulations. Journal of Volcanology and Geothermal Research, 175(4), 444-458. https://doi.org/10.1016/j.jvolgeores.2008.02.023
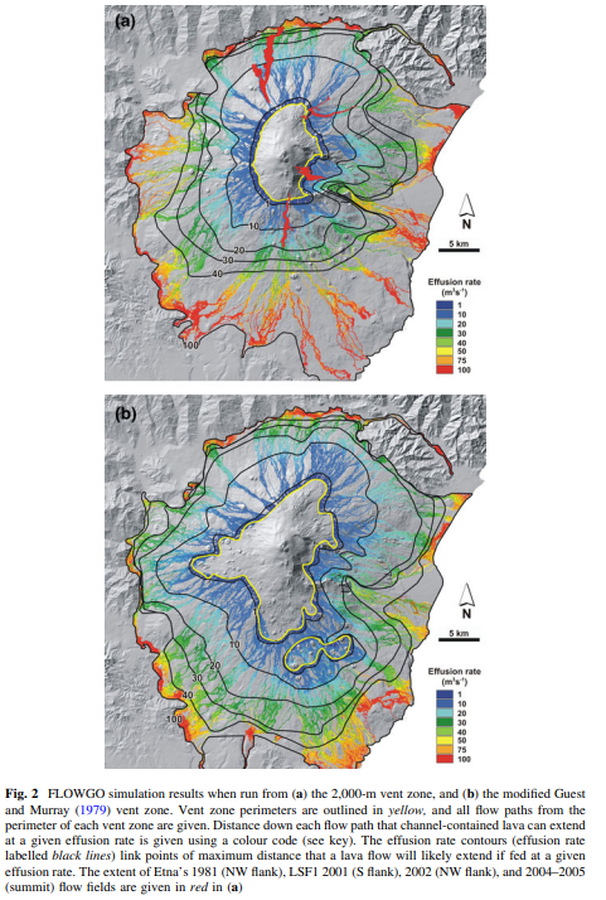
Figure in a journal article
FLOWGO simulation results when run from the 2,000-m vent zone, and the modified Guest and Murray (1979) vent zone.
Figure 2 in: Harris, A. J., Favalli, M., Wright, R., & Garbeil, H. (2011). Hazard assessment at Mount Etna using a hybrid lava flow inundation model and satellite-based land classification. Natural Hazards, 58(3), 1001-1027. https://doi.org/10.1007/s11069-010-9709-0
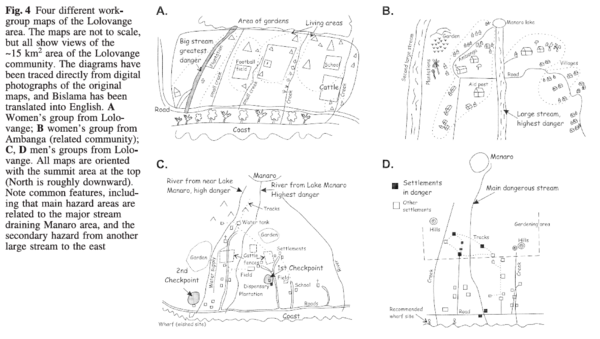
Figure in a journal article
Four different workgroup maps of the Lolovange area
Figure 4 in: Cronin, S.J., Gaylord, D.R., Charley, D., Alloway, B.V., Wallez, S., & Esau, J.W. (2004). Participatory methods of incorporating scientific with traditional knowledge for volcanic hazard management on Ambae Island, Vanuatu. Bulletin of volcanology, 66(7), p. 652-668. https://doi.org/10.1007/s00445-004-0347-9