
Advanced Search for Maps
Showing 51-60 of 218
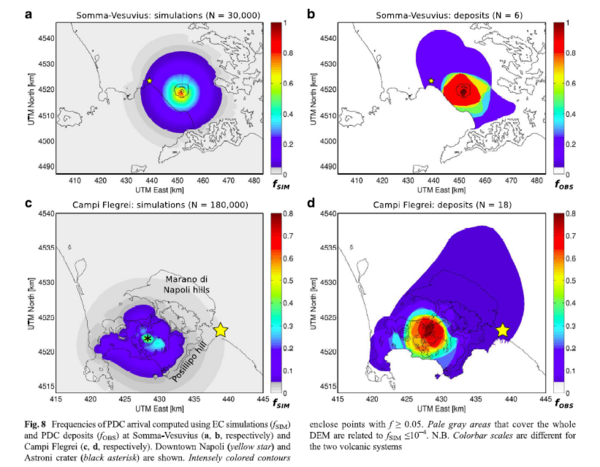
Figure in a journal article
Frequencies of PDC arrival computed using EC simulations and PDC deposits at Somma-Vesuvius and Campi Flegrei
Figure 8c-d in: Tierz, P., Sandri, L., Costa, A., Zaccarelli, L., Di Vito, M. A., Sulpizio, R., & Marzocchi, W. (2016). Suitability of energy cone for probabilistic volcanic hazard assessment: validation tests at Somma-Vesuvius and Campi Flegrei (Italy). Bulletin of Volcanology, 78(11). https://doi.org/10.1007/s00445-016-1073-9
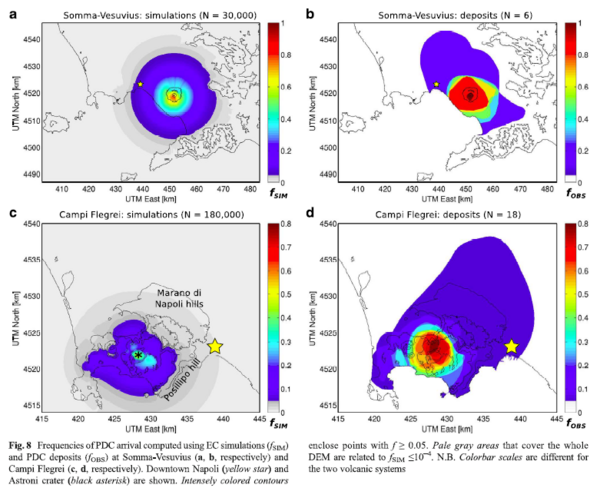
Figure in a journal article
Frequencies of PDC arrival computed using EC simulations and PDC deposits at Somma-Vesuvius and Campi Flegrei
Figure 8a-b in: Tierz, P., Sandri, L., Costa, A., Zaccarelli, L., Di Vito, M. A., Sulpizio, R., & Marzocchi, W. (2016). Suitability of energy cone for probabilistic volcanic hazard assessment: validation tests at Somma-Vesuvius and Campi Flegrei (Italy). Bulletin of Volcanology, 78(11). https://doi.org/10.1007/s00445-016-1073-9
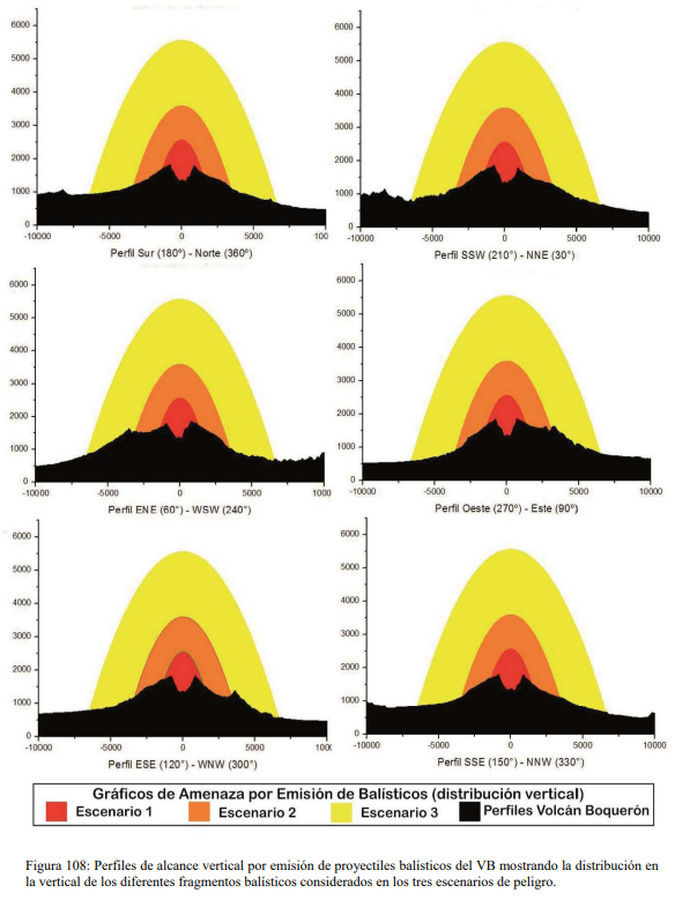
Figure in a thesis or dissertation
Gráficos de Amenaza por Emisión de Balísticos (distribución vertical)
(Ballistic Emission Threat Charts (vertical distribution))
Figure 108 in: Ferrés López, M.D. (2014). Estratigrafía, Geología y Evaluación de Peligros Volcánicos del Complejo Volcánico de San Salvador (El Salvador). Doctoral Thesis, Universidad Autónoma de México, México.
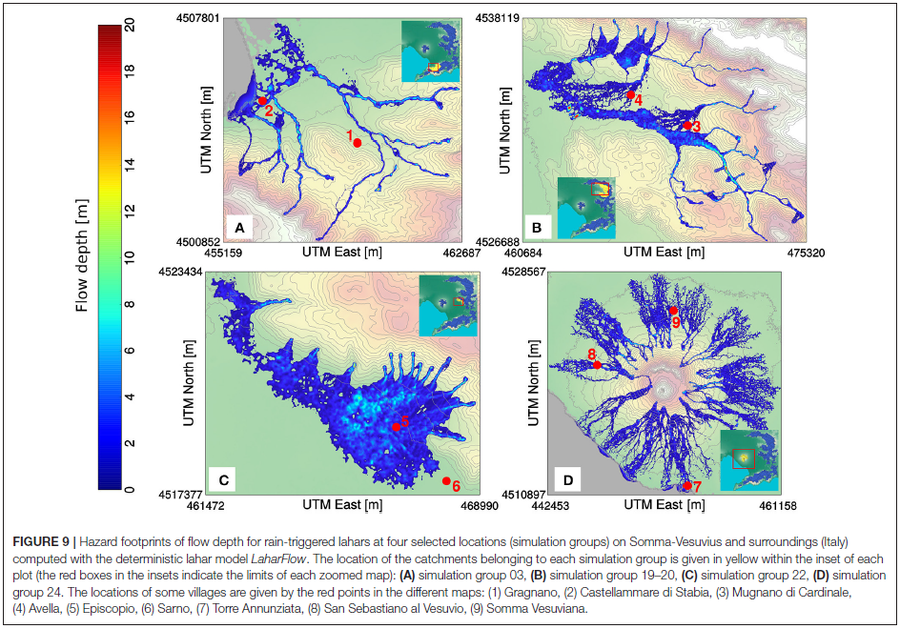
Figure in a journal article
Hazard footprints of flow depth for rain-triggered lahars at four selected locations (simulation groups) on Somma-Vesuvius and surroundings (Italy) computed with the deterministic lahar model LaharFlow
Figure 9 in: Tierz, P., Woodhouse, M.J., Phillips, J.C., Sandri, L., Selva, J., Marzocchi, W., & Odbert, H.M. (2017). A framework for probabilistic multi-hazard assessment of rain-triggered lahars using Bayesian belief networks. Frontiers in Earth Science, 5 (73). https://doi.org/10.3389/feart.2017.00073
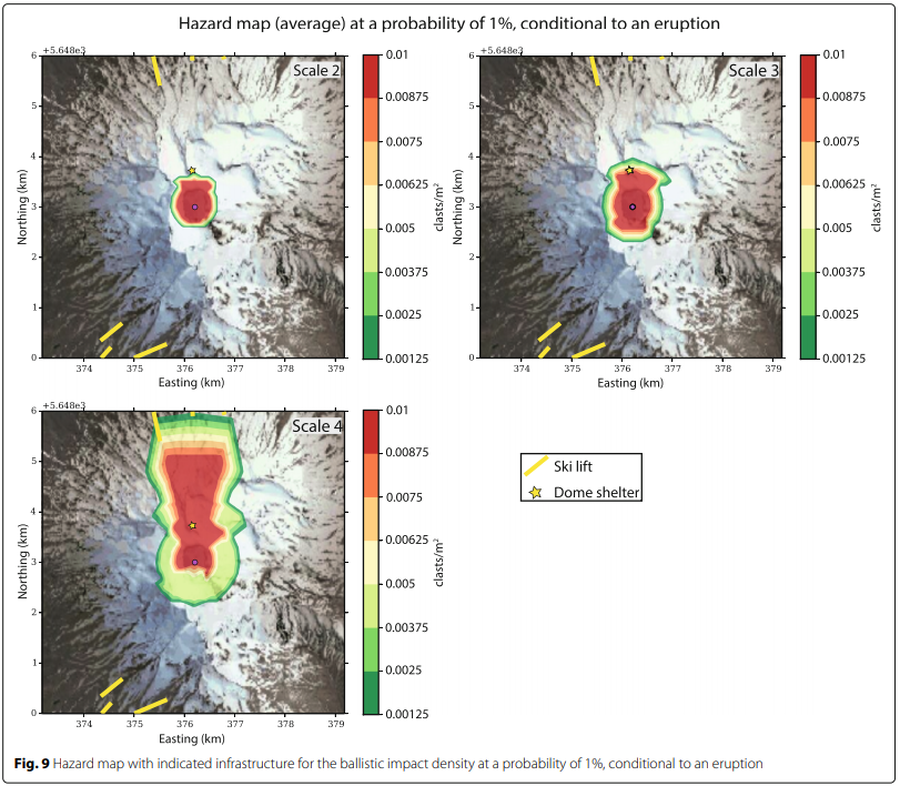
Figure in a journal article
Hazard map (average) at a probability of 1% conditional to an eruption
Figure 9 in: Strehlow, K., Sandri, L., Gottsmann, J. H., Kilgour, G., Rust, A. C., & Tonini, R. (2017). Phreatic eruptions at crater lakes: occurrence statistics and probabilistic hazard forecast. Journal of Applied Volcanology, 6(1), 4. https://doi.org/10.1186/s13617-016-0053-2
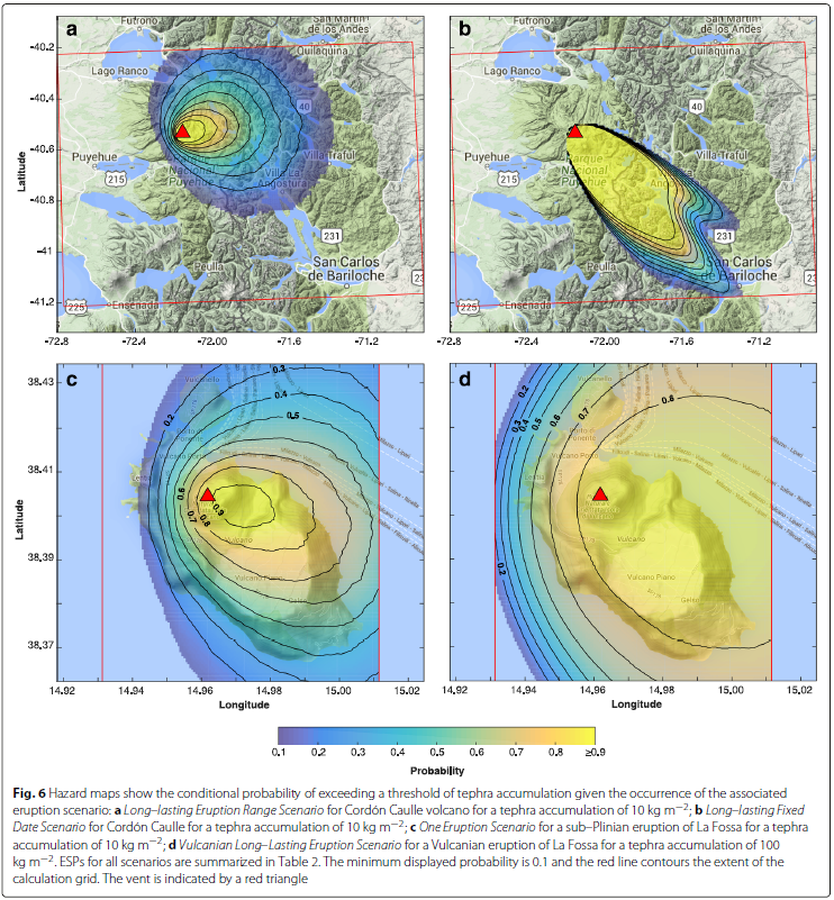
Figure in a journal article
Hazard maps show the conditional probability of exceeding a threshold of tephra accumulation given the occurrence of the associated eruption scenario
Figure 6 in: Biass, S., Bonadonna, C., Connor, L., & Connor, C. (2016). TephraProb: a Matlab package for probabilistic hazard assessments of tephra fallout. Journal of Applied Volcanology, 5(1), 1-16. https://doi.org/10.1186/s13617-016-0050-5
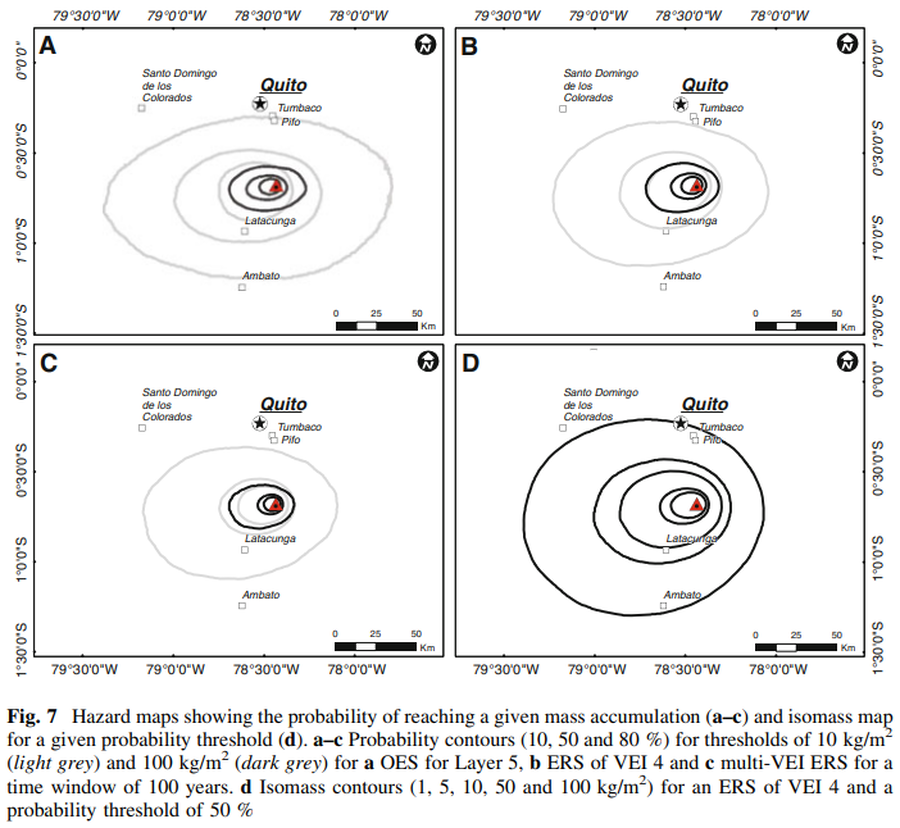
Figure in a journal article
Hazard maps showing the probability of reaching a given mass accumulation (a–c) and isomass map for a given probability threshold (d)
Figure 7 in: Biass, S., & Bonadonna, C. (2013). A fast GIS-based risk assessment for tephra fallout: the example of Cotopaxi volcano, Ecuador. Natural Hazards, 65, 477-495. https://doi.org/10.1007/s11069-012-0378-z
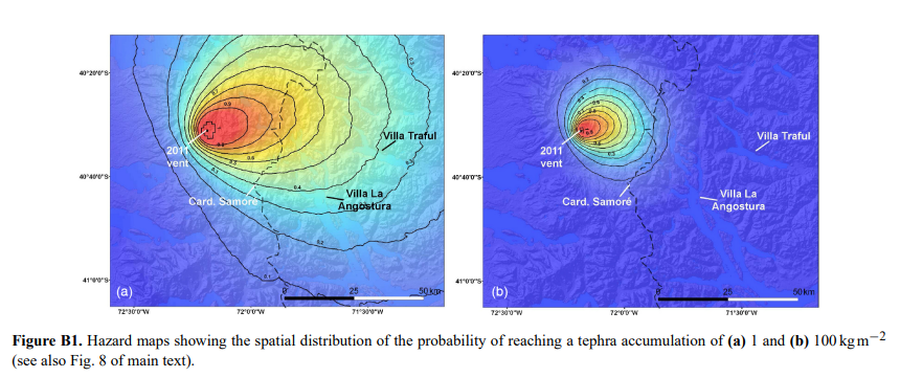
Figure in a journal article
Hazard maps showing the spatial distribution of the probability of reaching a tephra accumulation of (a) 1 and (b) 100 kg m−2
Figure B1 in: Elissondo, M., Baumann, V., Bonadonna, C., Pistolesi, M., Cioni, R., Bertagnini, A., Biass, S., Herrero, J.-C., & Gonzalez, R. (2016). Chronology and impact of the 2011 Cordón Caulle eruption, Chile. Natural Hazards and Earth System Sciences, 16(3), 675-704. https://doi.org/10.5194/nhess-16-675-2016, 2016
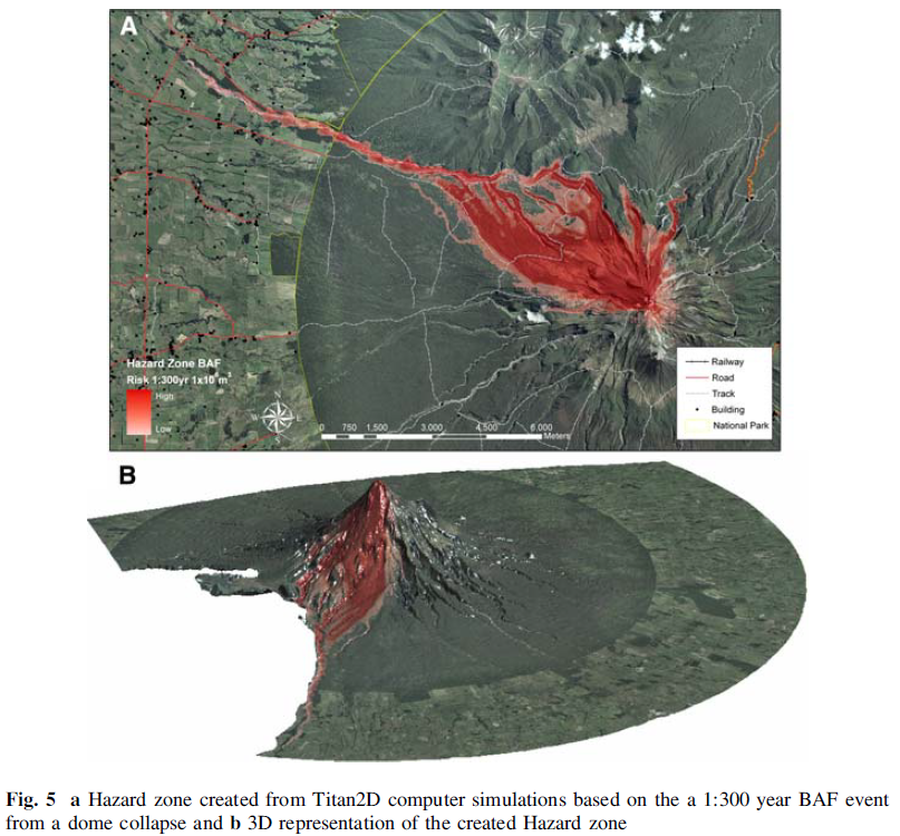
Figure in a journal article
Hazard zone created from Titan2D computer simulations based on the 1:300 year BAF event from a dome collapse and 3D representation of the created Hazard zone
Figure 5 in: Procter, J. N., Cronin, S. J., Platz, T., Patra, A., Dalbey, K., Sheridan, M., & Neall, V. (2010). Mapping block-and-ash flow hazards based on Titan 2D simulations: a case study from Mt. Taranaki, NZ. Natural Hazards, 53, 483-501.
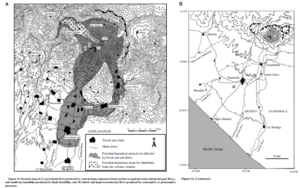
Official, Figure in a journal article
Hazards map of pyroclastic flows produced by central dome explosions based on four recognized events during the past 40 k.y., and small-size landslides produced by flank instability, and debris and hyperconcentrated flows produced by syneruptive or posteruptive processes.
Figure 14 in: Macias, J. L., Espíndola, J. M., Garcia-Palomo, A., Scott, K. M., Hughes, S., & Mora, J. C. (2000). Late Holocene Peléan-style eruption at Tacaná volcano, Mexico and Guatemala: Past, present, and future hazards. Geological Society of America Bulletin, 112(8), p. 1234-1249. https://doi.org/10.1130/0016-7606(2000)112%3C1234:LHPEAT%3E2.0.CO;2