
Advanced Search for Maps
Showing 31-40 of 218

Official, Figure in hazard assessment
Dispersión de las PTS por la emisión del volcán Arenal
(Dispersion of PTS due to emissions from the Arenal volcano)
Figure 6.9 in: Alvarado, G.E., Brenes-André, F., Núñez, D., Borbón, J., Ramírez, M.A., Alpízar, Y., Núñez, S., Sibaja, J.P., Esquivel, L. (2023). Actualización del Análisis del Peligro Volcánico del Arenal, Costa Rica. Instituto Costarricense de Electricidad (ICE). Mayo 2023.
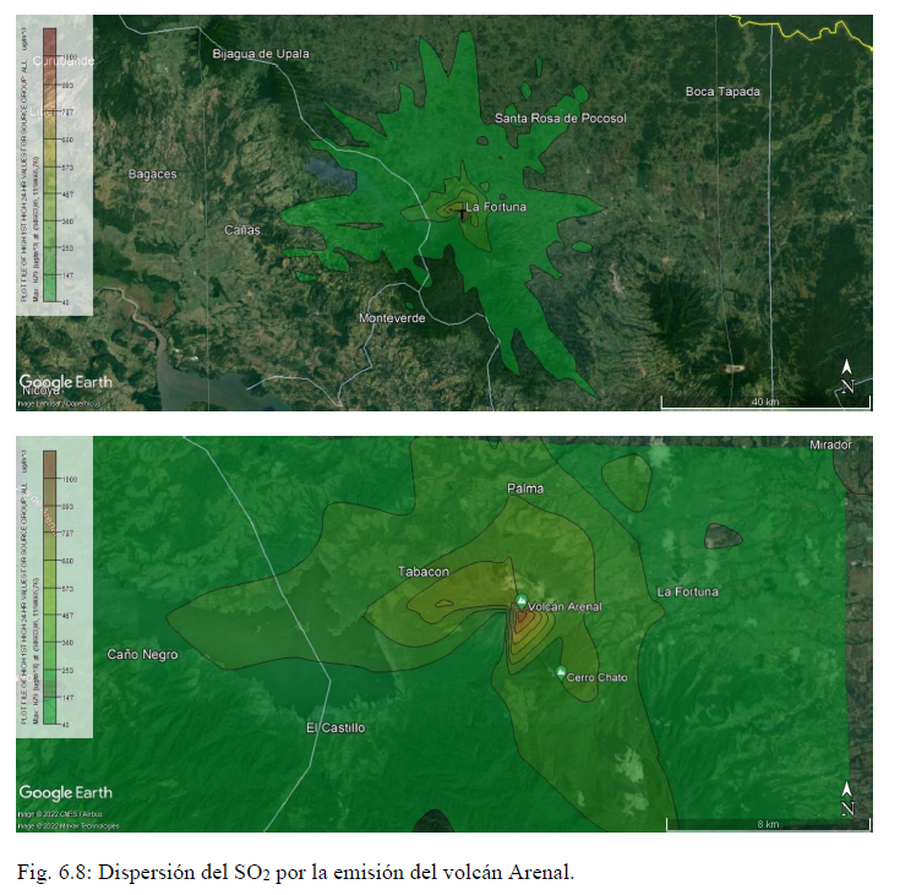
Official, Figure in hazard assessment
Dispersión del SO2 por la emisión del volcán Arenal
(SO2 dispersion due to emissions from the Arenal volcano)
Figure 6.8 in: Alvarado, G.E., Brenes-André, F., Núñez, D., Borbón, J., Ramírez, M.A., Alpízar, Y., Núñez, S., Sibaja, J.P., Esquivel, L. (2023). Actualización del Análisis del Peligro Volcánico del Arenal, Costa Rica. Instituto Costarricense de Electricidad (ICE). Mayo 2023.
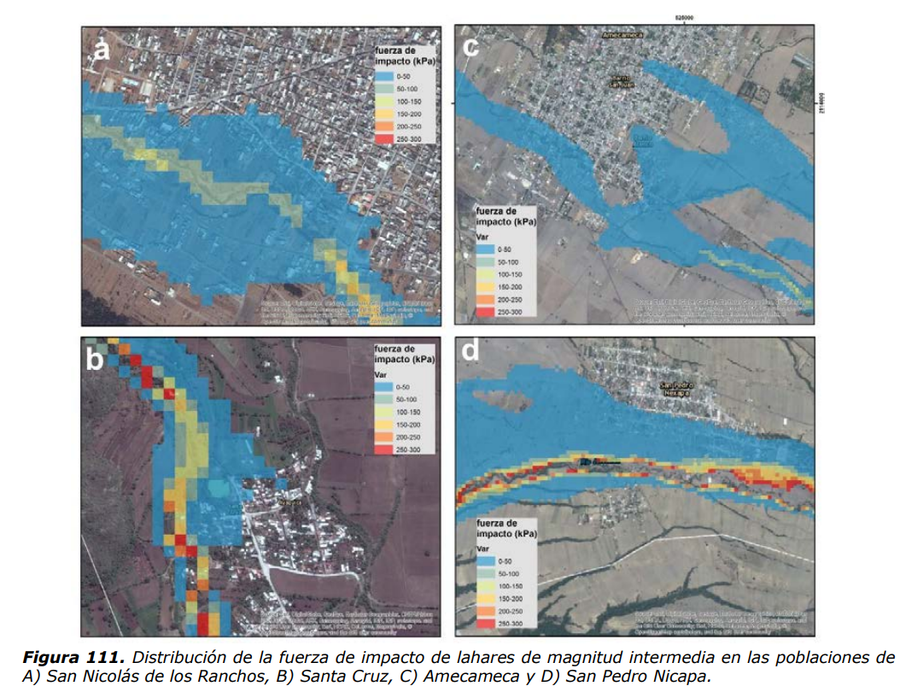
Official, Figure in hazard assessment
Distribución de la fuerza de impacto de lahares de magnitud intermedia
(Distribution of the impact force of lahars of intermediate magnitude)
Figure 111 in: Martin Del Pozzo, A.L, Alatorre Ibargüengoitia M., Arana Salinas L., Bonasia R., Capra Pedol L., Cassata W., Cordoba G., Cortés Ramos J., Delgado Granados H., Ferrés López M.D., Fonseca Álvarez R., García Reynoso J.A., Gisbert G., Guerrero López D.A., Jaimes Viera M., Macías Vázquez J.L., Nieto Obregon J., Nieto Torres A., Paredes Ruiz P.A., Portocarrero Martínez J., Renne P., Rodríguez Espinosa D.M., Salinas Sánchez S., Siebe Grabach C., & Tellez Ugalde E. (2017). Estudios geológicos y actualización del mapa de peligros del volcán Popocatépetl. Memoria técnica del mapa de peligros del volcán Popocatépetl. Instituto de Geofísica, Universidad Nacional Autónoma de México (UNAM).

Official, Figure in hazard assessment
Distribución probabilística de lavas originados en diferentes puntos del volcán
(Probabilistic distribution of lavas originating from different points on the volcano)
Figure 83 in: Soto, G.J. (2012). Preparación de mapas de peligros volcánicos y restricción de uso de la tierra en el volcán Turrialba. FUNDEVI, Universidad de Costa Rica, Escuela Centroamericana de Geología. 186 p.

Figure in a journal article
Early simulations carried out before the onset of the effusive eruption
Figure 4 in: Tarquini, S., de'Michieli Vitturi, M., Jensen, E. H., Pedersen, G. B., Barsotti, S., Coppola, D., & Pfeffer, M. A. (2018). Modeling lava flow propagation over a flat landscape by using MrLavaLoba: the case of the 2014–2015 eruption at Holuhraun, Iceland. Annals of Geophysics. https://doi.org/10.4401/ag-7812
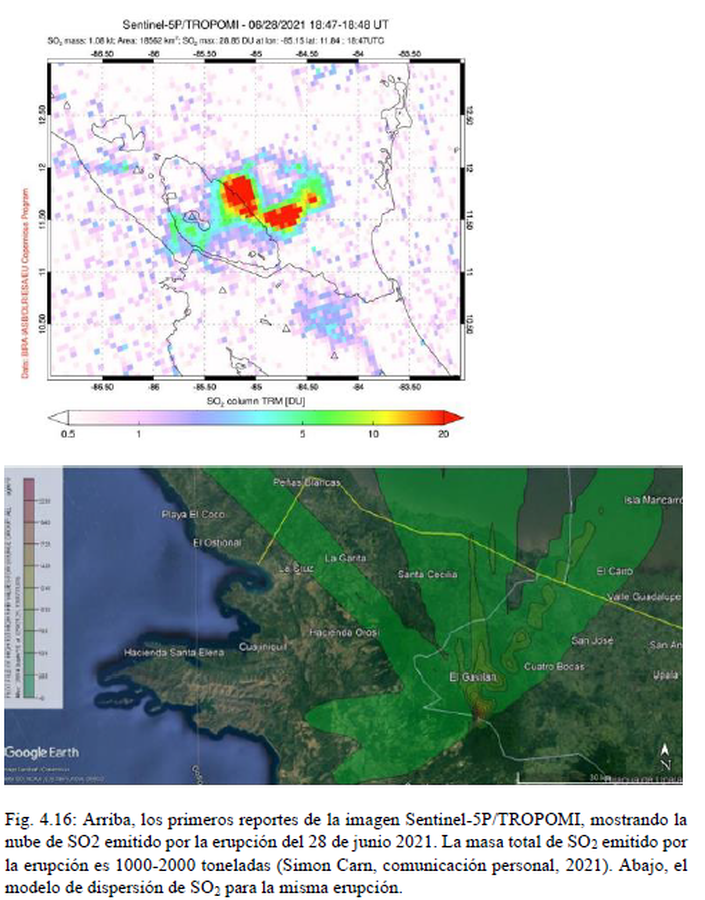
Official, Figure in hazard assessment
El modelo de dispersión de SO2 para la misma erupción
(The SO2 dispersion model for the same eruption)
Figure 4.16 in: Alvarado, G.E., Brenes-André, J., Venegas, L., Alpízar, Y., Núñez, S., Sánchez, M., Abarca, K., Abarca, J., Báez, W.A., Sibaja, J.P., Esquivel, L., & Arcia, T. (2022). Análisis del Peligro Volcánico del Rincón de la Vieja, Costa Rica. Instituto Costarricense de Electricidad (ICE). Setiembre 2022.
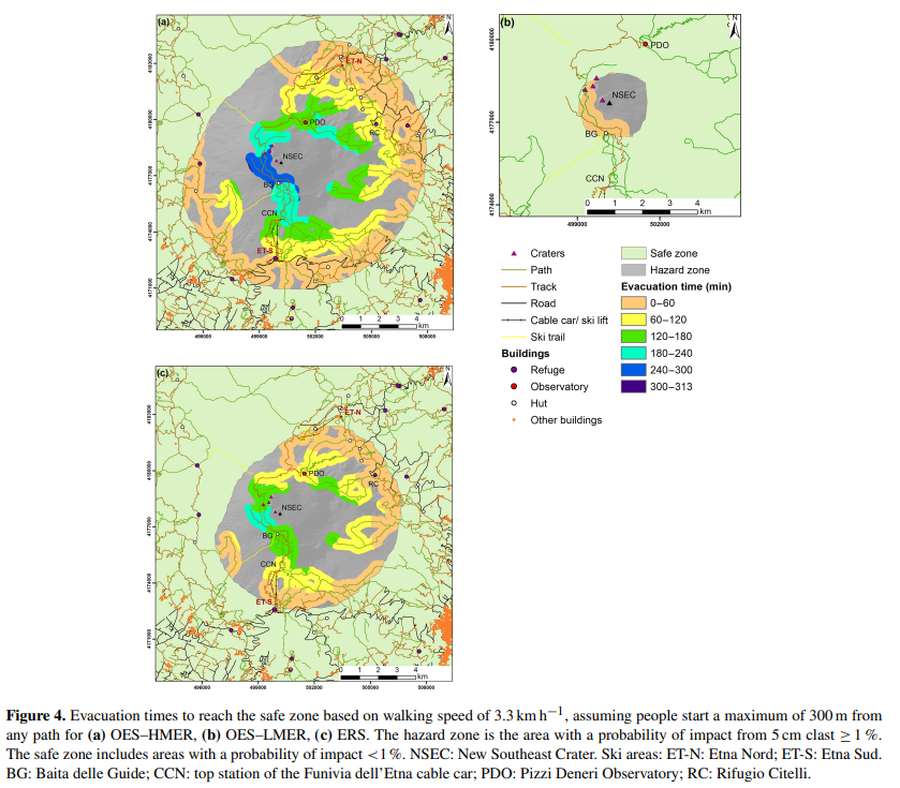
Figure in a journal article
Evacuation times to reach the safe zone based on walking speed of 3.3 km h^−1
Figure 4 in: Osman, S., Rossi, E., Bonadonna, C., Frischknecht, C., Andronico, D., Cioni, R., & Scollo, S. (2019). Exposure-based risk assessment and emergency management associated with the fallout of large clasts at Mount Etna. Natural Hazards and Earth System Sciences, 19(3), 589-610. https://doi.org/10.5194/nhess-19-589-2019
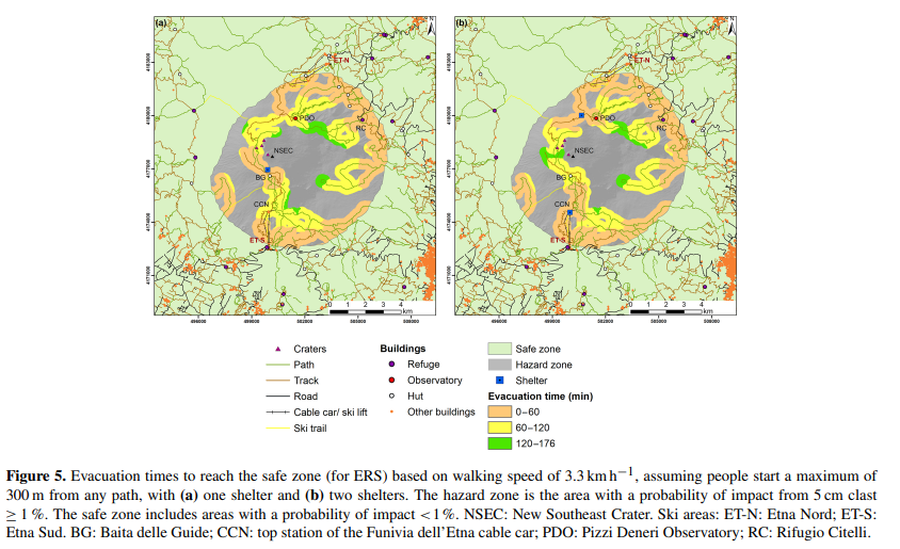
Figure in a journal article
Evacuation times to reach the safe zone based on walking speed of 3.3 km h^−1, assuming people start a maximum of 300 m from any path, with (a) one shelter and (b) two shelters
Figure 5 in: Osman, S., Rossi, E., Bonadonna, C., Frischknecht, C., Andronico, D., Cioni, R., & Scollo, S. (2019). Exposure-based risk assessment and emergency management associated with the fallout of large clasts at Mount Etna. Natural Hazards and Earth System Sciences, 19(3), 589-610. https://doi.org/10.5194/nhess-19-589-2019
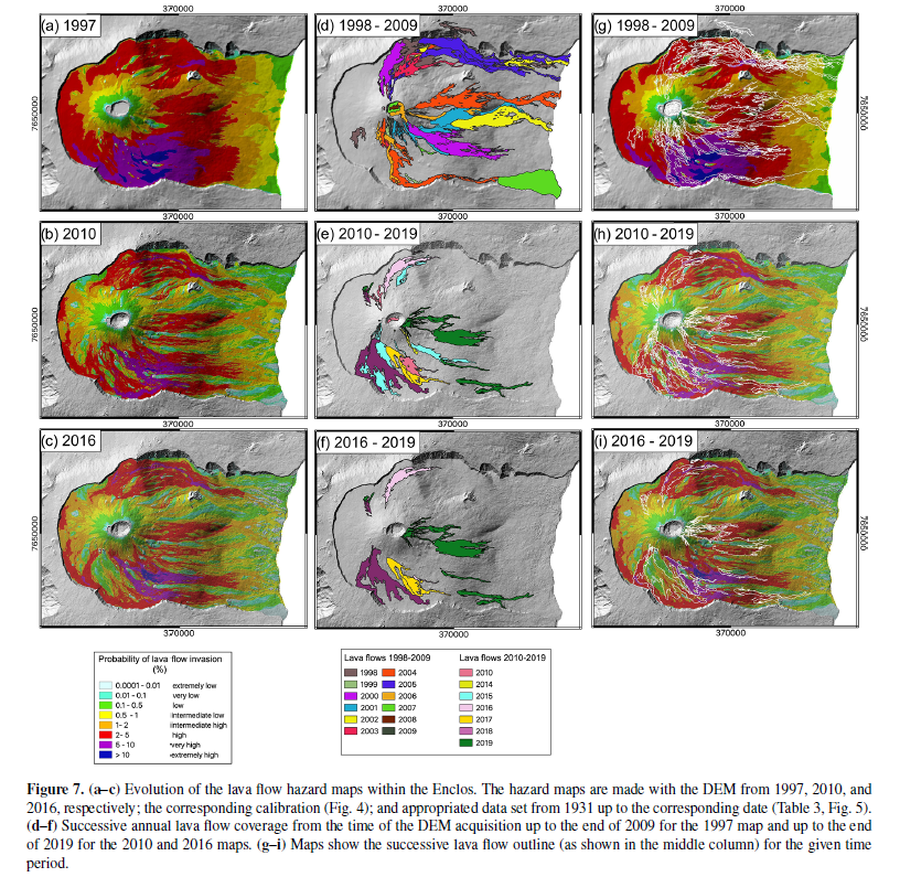
Figure in a journal article
Evolution of the lava flow hazard maps within the Enclos
Figure 7 in: Chevrel, M. O., Favalli, M., Villeneuve, N., Harris, A. J., Fornaciai, A., Richter, N., Derrien, A., Di Muro, A., & Peltier, A. (2021). Lava flow hazard map of Piton de la Fournaise volcano. Natural Hazards and Earth System Sciences, 21(8), 2355-2377. https://doi.org/10.5194/nhess-21-2355-2021, 2021
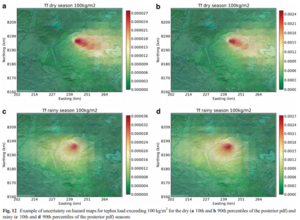
Figure in a journal article
Example of uncertainty on hazard maps for tephra load exceeding 100 kg/m² for the dry (10th and 90th percentiles of the posterior pdf) and rainy (10th and 90th percentiles of the posterior pdf) seasons
Figure 12 in: Sandri, L., Thouret, J. C., Constantinescu, R., Biass, S., & Tonini, R. (2014). Long-term multi-hazard assessment for El Misti volcano (Peru). Bulletin of volcanology, 76(2), 771. https://doi.org/10.1007/s00445-013-0771-9