
Advanced Search for Maps
Showing 1-10 of 56
Official, Insert/poster-size map with accompanying report
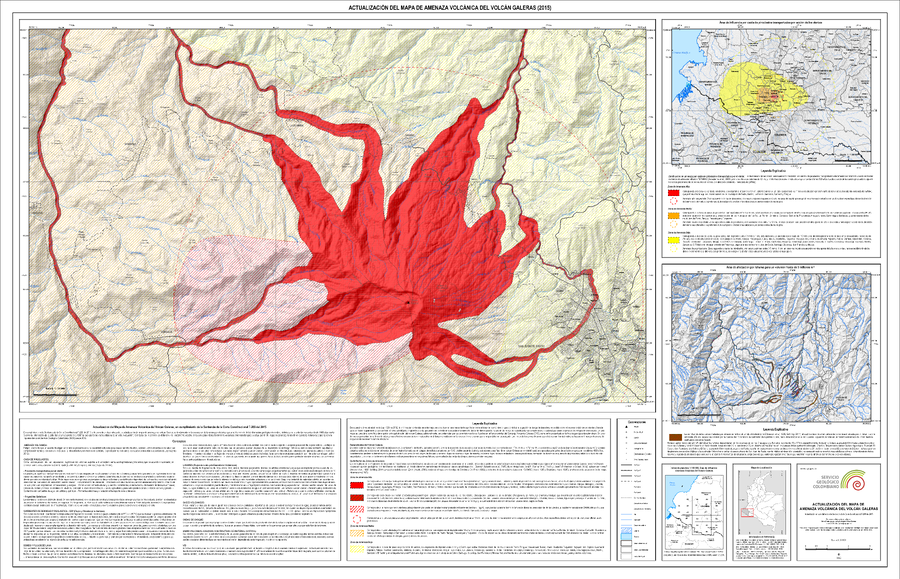
Actualización del Mapa de Amenaza Volcánica del Volcán Galeras (2015)
(Update of the Volcanic Hazard Map of the Galeras Volcano (2015))
Pocket insert in: Servicio Geológico Colombiano (SGC) Direccion de Geoamenazas. (2015). Actualización del Mapa de Amenaza Volcánica del Volcán Galeras - Colombia. En cumplimiento a la Sentencia de la Corte Constitucional T-269 de 2015.
Official, Figure in hazard assessment
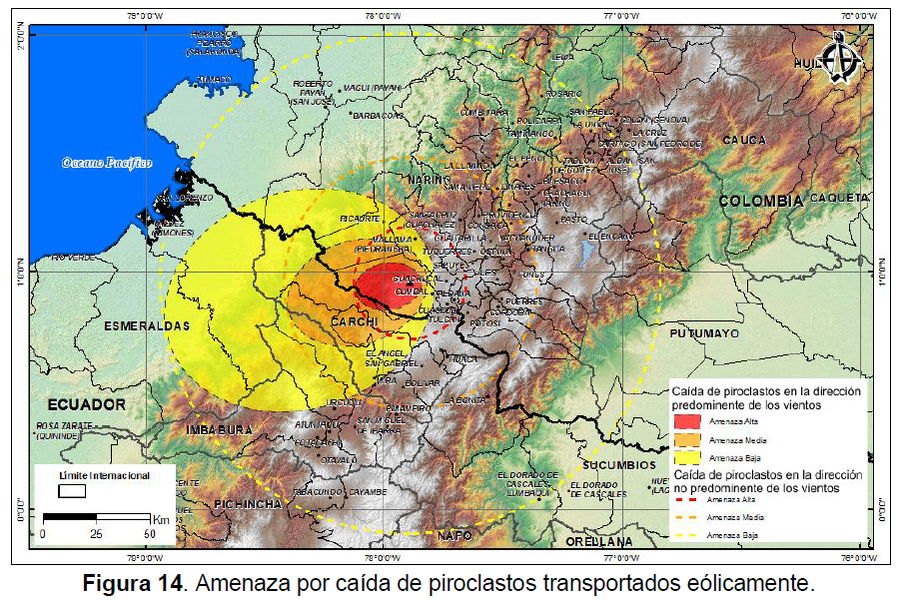
Amenaza por caída de piroclastos transportados eólicamente
(Hazard from falling wind-borne pyroclasts)
Figure 14 in: Méndez, R., Narváez, P., Muñoz, C. (2014). Mapa de Amenaza Volcánica del Complejo Volcánico Cumbal -- Segunda Versión. Memoria Explicativa. San Juan de Pasto: Servicio Geológico Colombiano.
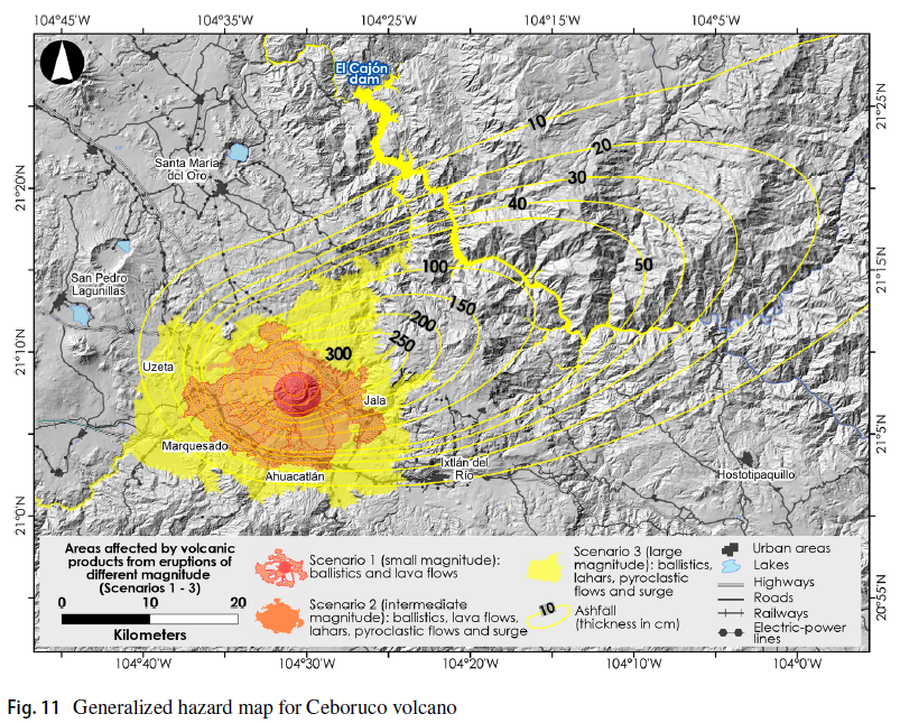
Figure in a journal article
Areas affected by volcanic products from eruptions of different magnitude (Scenarios 1-3)
Figure 11 in: Sieron, K., Ferrés, D., Siebe, C., Constantinescu, R., Capra, L., Connor, C., Connor, L., Groppelli, G. & Zuccolotto, K.G. (2019). Ceboruco hazard map: part II—modeling volcanic phenomena and construction of the general hazard map. Natural Hazards, 96(2), p. 893-933. https://doi.org/10.1007/s11069-019-03577-5
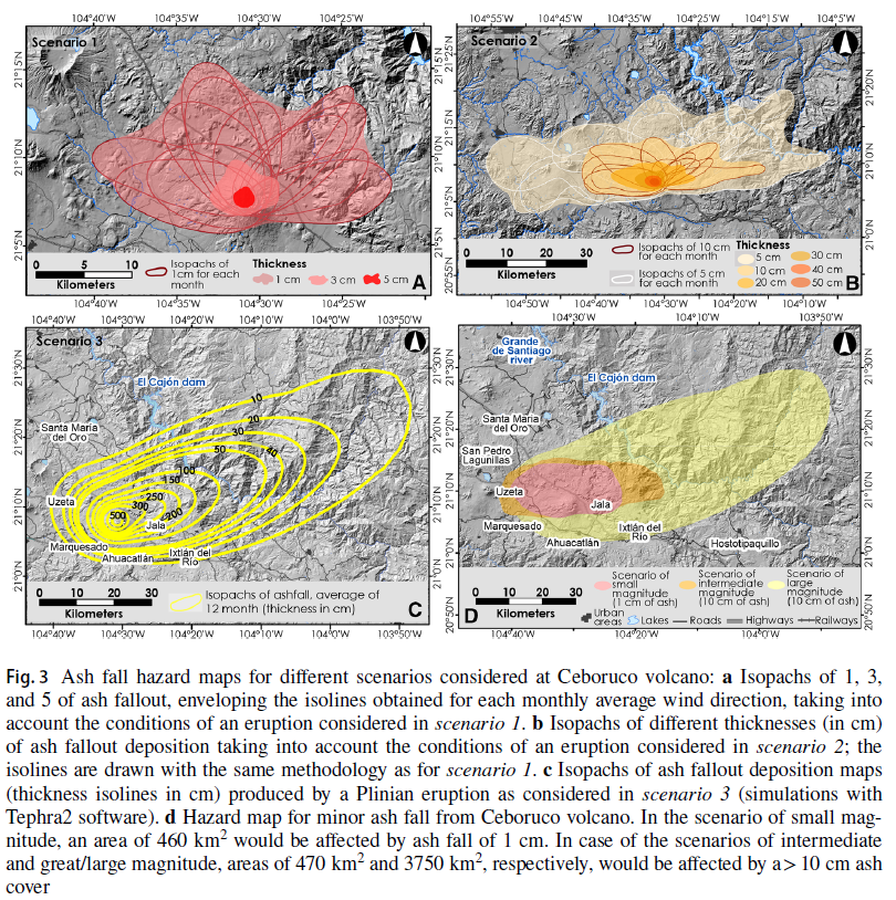
Figure in a journal article
Ash fall hazard maps for different scenarios considered at Ceboruco volcano
Figure 3 in: Sieron, K., Ferrés, D., Siebe, C., Constantinescu, R., Capra, L., Connor, C., Connor, L., Groppelli, G. & Zuccolotto, K.G. (2019). Ceboruco hazard map: part II—modeling volcanic phenomena and construction of the general hazard map. Natural Hazards, 96(2), p. 893-933. https://doi.org/10.1007/s11069-019-03577-5
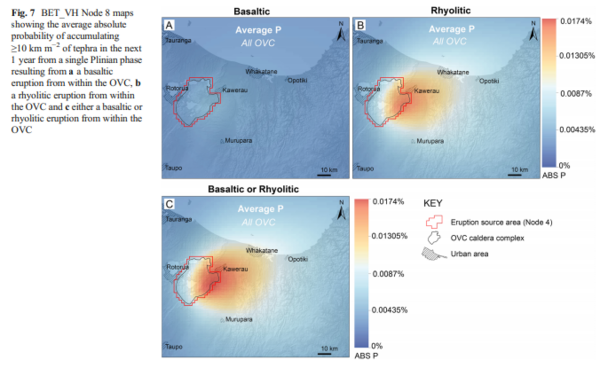
Figure in a journal article
BET_VH Node 8 maps showing the average absolute probability of accumulating ≥10 km m−2 of tephra in the next 1 year from a single Plinian phase resulting from a a basaltic eruption from within the OVC, b a rhyolitic eruption from within the OVC and c either a basaltic or rhyolitic eruption from within the OVC
Figure 7 in: Thompson, M. A., Lindsay, J. M., Sandri, L., Biass, S., Bonadonna, C., Jolly, G., & Marzocchi, W. (2015). Exploring the influence of vent location and eruption style on tephra fall hazard from the Okataina Volcanic Centre, New Zealand. Bulletin of volcanology, 77(5), 38. https://doi.org/10.1007/s00445-015-0926-y
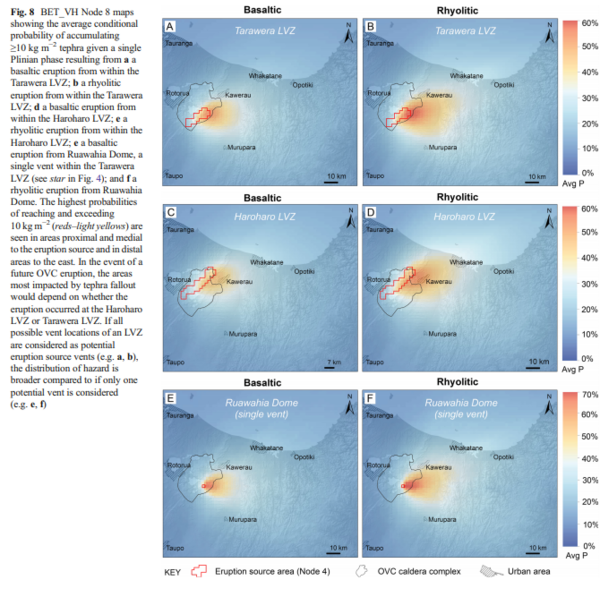
Figure in a journal article
BET_VH Node 8 maps showing the average conditional probability of accumulating ≥10 kg m−2 tephra given a single Plinian phase resulting from a a basaltic eruption from within the Tarawera LVZ; b a rhyolitic eruption from within the Tarawera LVZ; d a basaltic eruption from within the Haroharo LVZ; e a rhyolitic eruption from within the Haroharo LVZ; e a basaltic eruption from Ruawahia Dome, a single vent within the Tarawera LVZ (see star in Fig. 4); and f a rhyolitic eruption from Ruawahia Dome
Figure 8 in: Thompson, M. A., Lindsay, J. M., Sandri, L., Biass, S., Bonadonna, C., Jolly, G., & Marzocchi, W. (2015). Exploring the influence of vent location and eruption style on tephra fall hazard from the Okataina Volcanic Centre, New Zealand. Bulletin of volcanology, 77(5), 38. https://doi.org/10.1007/s00445-015-0926-y
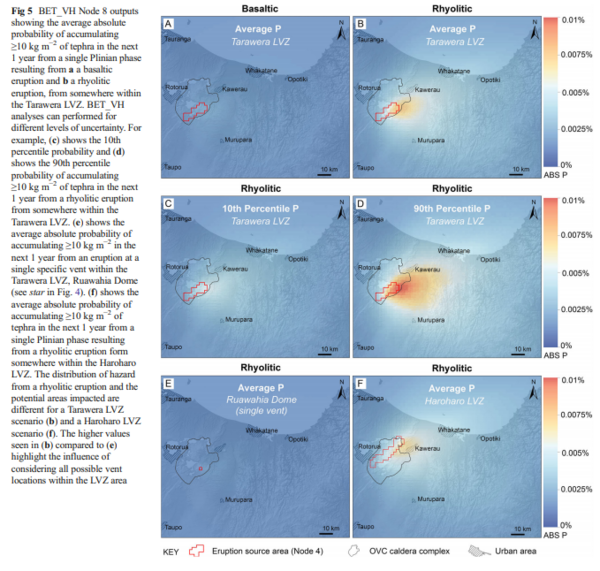
Figure in a journal article
BET_VH Node 8 outputs showing the average absolute probability of accumulating ≥10 kg m−2 of tephra in the next 1 year from a single Plinian phase resulting from a a basaltic eruption and b a rhyolitic eruption, from somewhere within the Tarawera LVZ
Figure 5 in: Thompson, M. A., Lindsay, J. M., Sandri, L., Biass, S., Bonadonna, C., Jolly, G., & Marzocchi, W. (2015). Exploring the influence of vent location and eruption style on tephra fall hazard from the Okataina Volcanic Centre, New Zealand. Bulletin of volcanology, 77(5), 38. https://doi.org/10.1007/s00445-015-0926-y
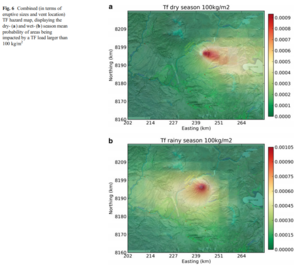
Figure in a journal article
Combined (in terms of eruptive sizes and vent location) TF hazard map, displaying the dry- and wet-season mean probability of areas being impacted by a TF load larger than 100 kg/m²
Figure 6 in: Sandri, L., Thouret, J. C., Constantinescu, R., Biass, S., & Tonini, R. (2014). Long-term multi-hazard assessment for El Misti volcano (Peru). Bulletin of volcanology, 76(2), 771. https://doi.org/10.1007/s00445-013-0771-9
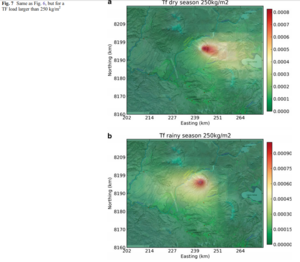
Figure in a journal article
Combined (in terms of eruptive sizes and vent location) TF hazard map, displaying the dry- and wet-season mean probability of areas being impacted by a TF load larger than 250 kg/m²
Figure 7 in: Sandri, L., Thouret, J. C., Constantinescu, R., Biass, S., & Tonini, R. (2014). Long-term multi-hazard assessment for El Misti volcano (Peru). Bulletin of volcanology, 76(2), 771. https://doi.org/10.1007/s00445-013-0771-9
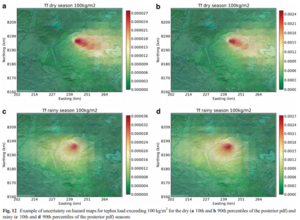
Figure in a journal article
Example of uncertainty on hazard maps for tephra load exceeding 100 kg/m² for the dry (10th and 90th percentiles of the posterior pdf) and rainy (10th and 90th percentiles of the posterior pdf) seasons
Figure 12 in: Sandri, L., Thouret, J. C., Constantinescu, R., Biass, S., & Tonini, R. (2014). Long-term multi-hazard assessment for El Misti volcano (Peru). Bulletin of volcanology, 76(2), 771. https://doi.org/10.1007/s00445-013-0771-9