
Advanced Search for Maps
Showing 1-10 of 123
Official, Figure on website
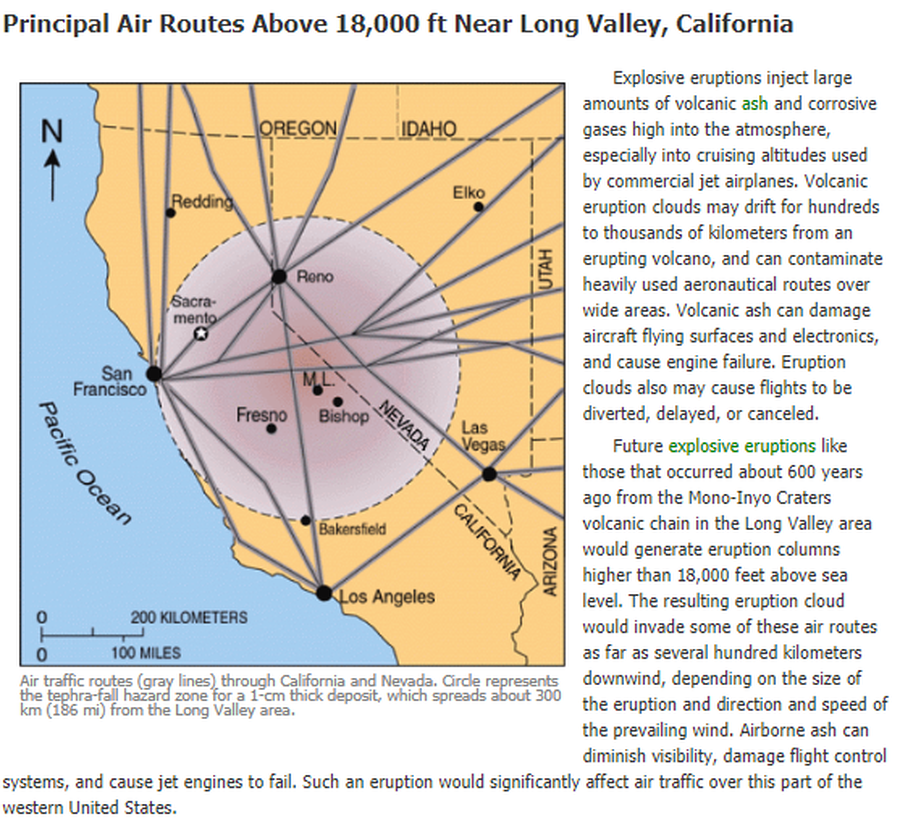
Air traffic routes (gray lines) through California and Nevada. Circle represents the tephra-fall hazard zone for a 1-cm thick deposit, which spreads about 300 km (186 mi) from the Long Valley area.
U.S. Geological Survey (USGS). (2012). Air traffic routes (gray lines) through CA and Nevada. U.S. Geological Survey. Long Valley Caldera Hazards, Principal Air Routes Above 18,000 ft Near Long Valley, California. https://www.usgs.gov/volcanoes/long-valley-caldera/principal-air-routes-above-18000-ft-near-long-valley-california
Official, Figure in hazard assessment
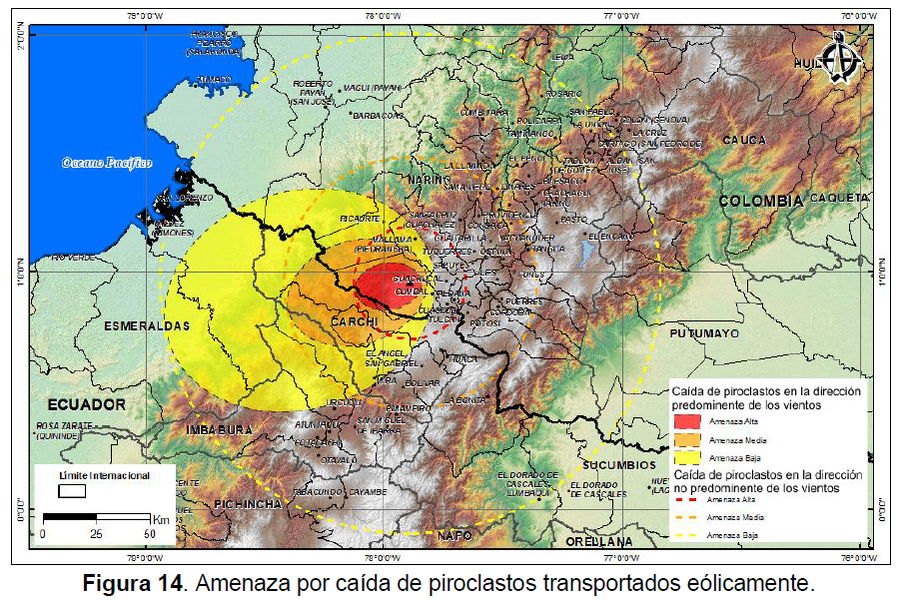
Amenaza por caída de piroclastos transportados eólicamente
(Hazard from falling wind-borne pyroclasts)
Figure 14 in: Méndez, R., Narváez, P., Muñoz, C. (2014). Mapa de Amenaza Volcánica del Complejo Volcánico Cumbal -- Segunda Versión. Memoria Explicativa. San Juan de Pasto: Servicio Geológico Colombiano.
Official, Figure in hazard assessment
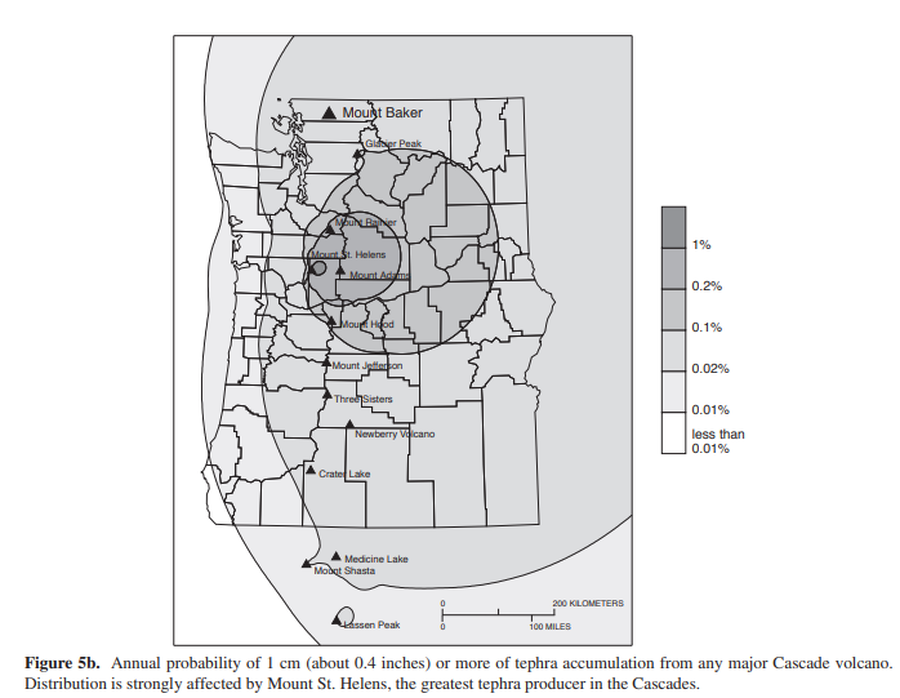
Annual probability of 1 cm (about 0.4 inches) or more of tephra accumulation from any major Cascade volcano
Figure 5b in: Gardner, C.A., Scott, K.M., Miller, C.D., Myers, B., Hildreth, W., & Pringle, P.T. (1995). Potential volcanic hazards from future activity of Mount Baker, Washington. U.S. Geological Survey, Open-File Report 95-498, 16 p., 1 plate, scale 1:100,000. https://doi.org/10.3133/ofr95498
Official, Figure in hazard assessment
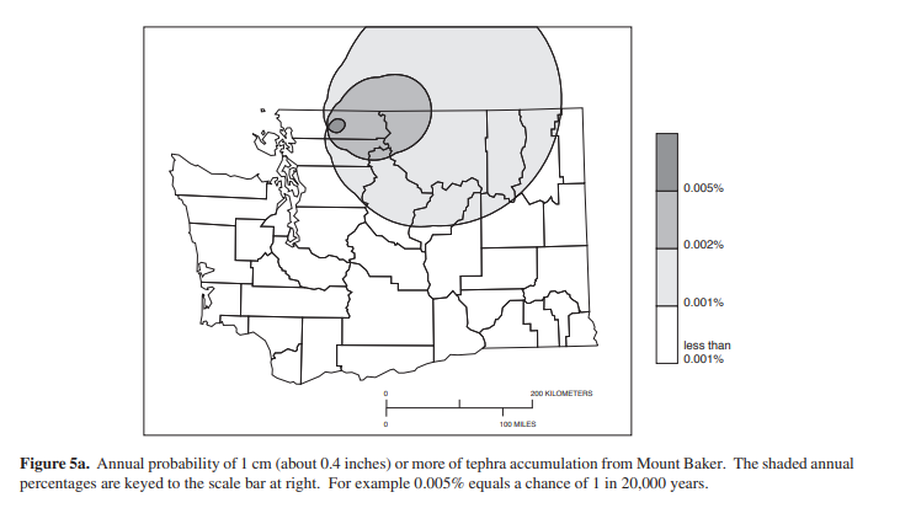
Annual probability of 1 cm (about 0.4 inches) or more of tephra from Mount Baker.
Figure 5a in: Gardner, C.A., Scott, K.M., Miller, C.D., Myers, B., Hildreth, W., & Pringle, P.T. (1995). Potential volcanic hazards from future activity of Mount Baker, Washington. U.S. Geological Survey, Open-File Report 95-498, 16 p., 1 plate, scale 1:100,000. https://doi.org/10.3133/ofr95498
Official, Figure in hazard assessment
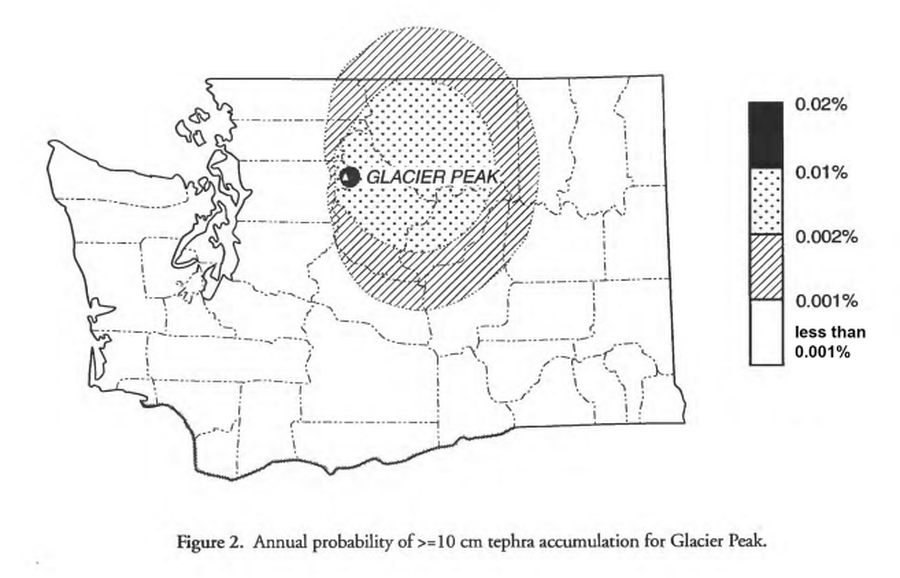
Annual probability of >=10 cm tephra accumulation for Glacier Peak
Figure 2 in: Waitt, R.B., Mastin, L.G., & Begét, J.E. (1995). Volcanic-Hazard Zonation for Glacier Peak Volcano, Washington. U.S. Geological Survey, Open-File Report 95-499, 9 p., 1 plate. https://doi.org/10.3133/ofr95499
Official, Figure in hazard assessment
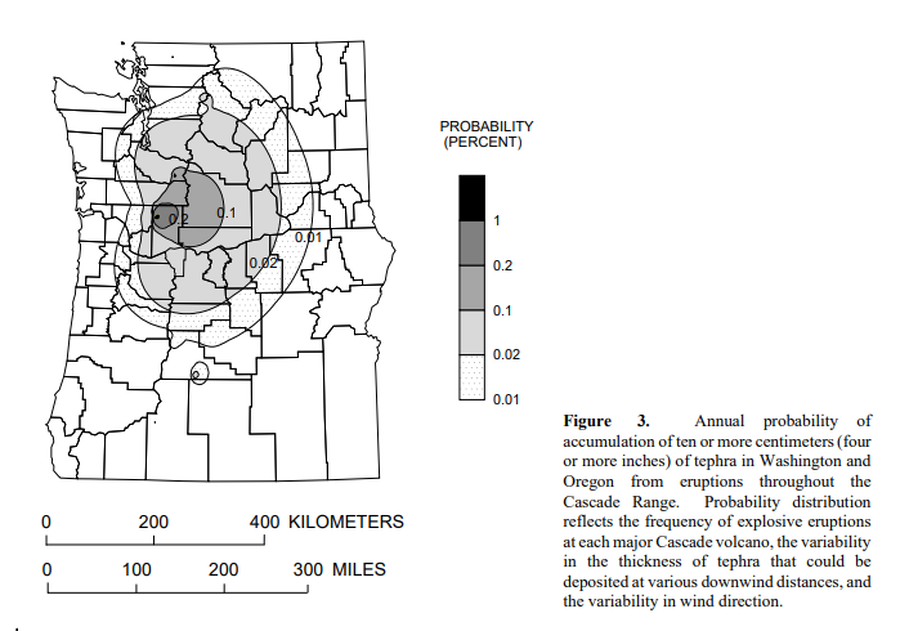
Annual probability of accumulation of ten or more centimeters (four or more inches) of tephra in Washington and Oregon from eruptions throughout the Cascade Range.
Figure 3 in: Wolfe, E.W. & Pierson, T.C. (1995). Volcanic-Hazard Zonation for Mount St. Helens, Washington, 1995. U.S. Geological Survey, Open-File Report 95-497, 12 p., 1 plate. https://doi.org/10.3133/ofr95497
Official, Figure in hazard assessment
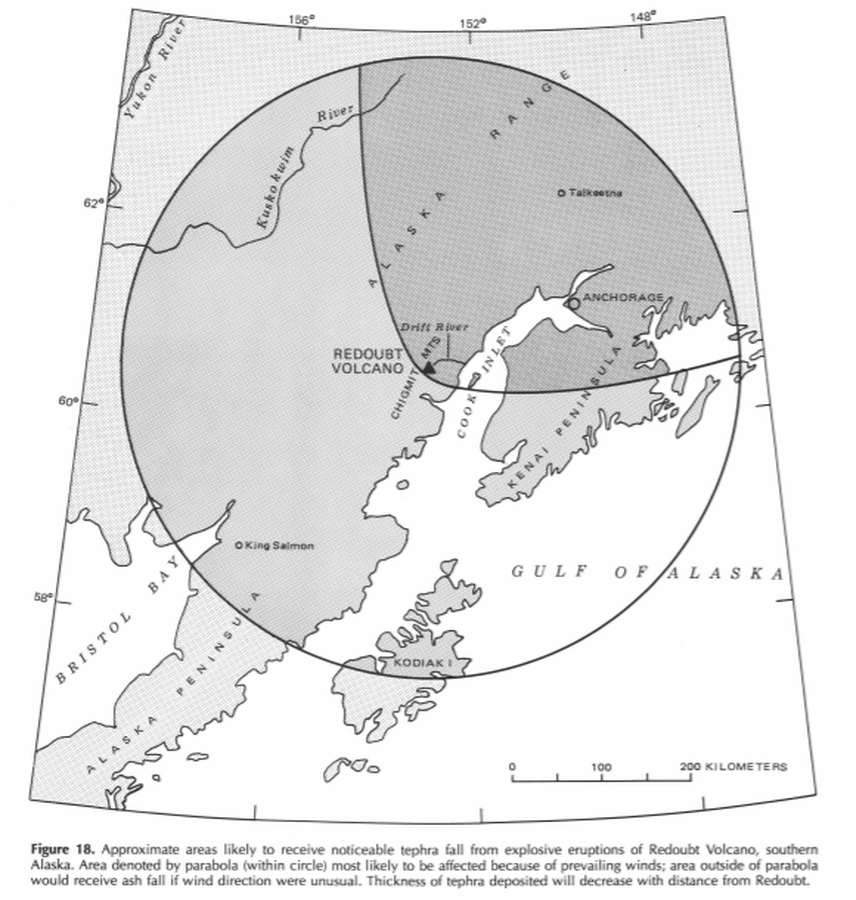
Approximate areas likely to receive noticeable tephra fall from explosive eruptions of Redoubt Volcano, southern Alaska
Figure 18 in: Till, A.B., Yount, M.E., & Riehle, J.R. (1993). Redoubt Volcano, southern Alaska; a hazard assessment based on eruptive activity through 1968. U.S. Geological Survey, Bulletin 1996, 19 p., 1 plate. https://doi.org/10.3133/b1996
Official, Figure in hazard assessment
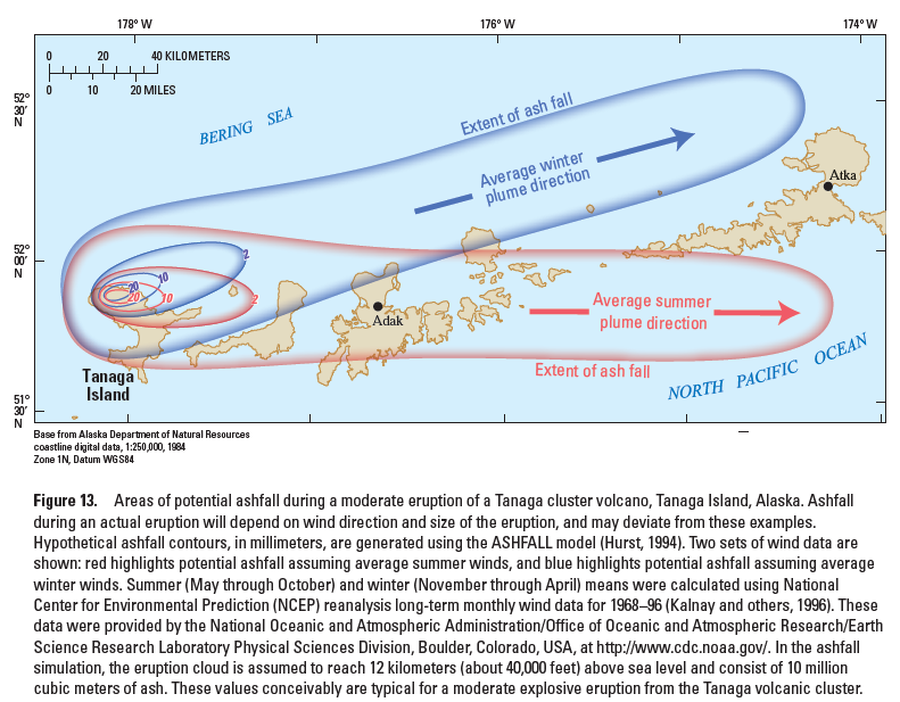
Areas of potential ashfall during a moderate eruption of a Tanaga cluster volcano, Tanaga Island, Alaska
Figure 13 in: Coombs, M.L., McGimsey, R.G. & Browne, B.L. (2007). Preliminary volcano-hazard assessment for the Tanaga volcanic cluster, Tanaga Island, Alaska. U.S. Geological Survey, Scientific Investigations Report 2007-5094, 41 p., 1 plate. https://doi.org/10.3133/sir20075094
Official, Figure in hazard assessment
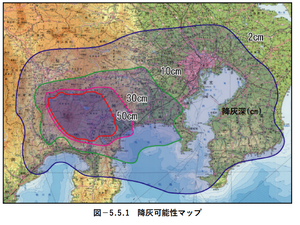
Ash fall possibility map
Figure 5.5.1 in: Mt. Fuji Hazard Map Review Committee. (2004). Mt. Fuji Hazard Map Review Committee Report. June 2004. https://www.bousai.go.jp/kazan/fuji_map/pdf/report_200406.pdf

Official, Figure on website
Ashfall model output for Yellowstone supereruption
U.S. Geological Survey (USGS). (2014). Ashfall model output for Yellowstone supereruption. U.S. Geological Survey. Modeling the Ash Distribution of a Yellowstone Supereruption (2014). https://www.usgs.gov/volcanoes/yellowstone/modeling-ash-distribution-yellowstone-supereruption-2014 (Simplified from: Mastin et al. 2014)