
Advanced Search for Maps
Showing 51-60 of 78
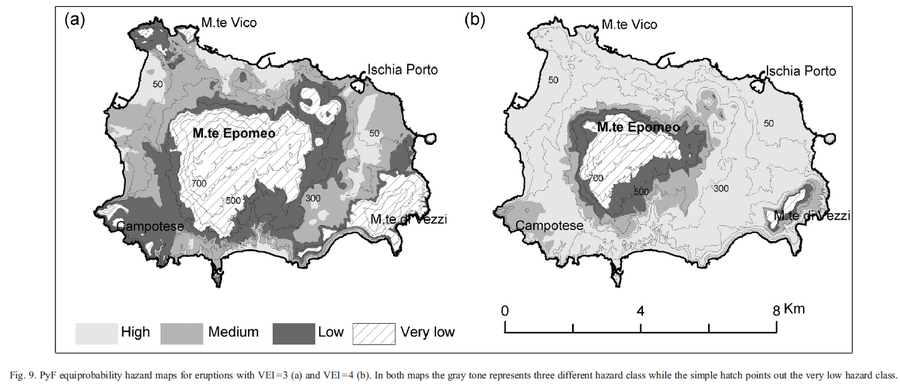
Figure in a journal article
PyF equiprobability hazard maps for eruptions with VEI = 3 and VEI = 4
Figure 9 in: Alberico, I., Lirer, L., Petrosino, P., & Scandone, R. (2008). Volcanic hazard and risk assessment from pyroclastic flows at Ischia island (southern Italy). Journal of volcanology and geothermal research, 171(1-2), 118-136.
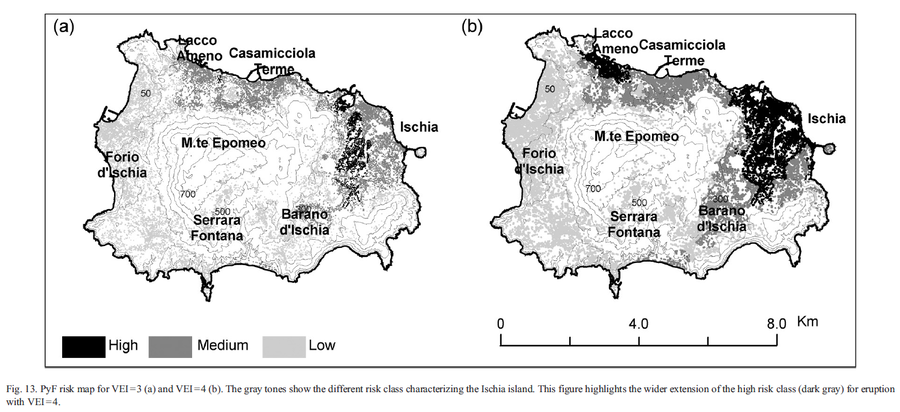
Figure in a journal article
PyF risk map for VEI = 3 and VEI = 4
Figure 13 in: Alberico, I., Lirer, L., Petrosino, P., & Scandone, R. (2008). Volcanic hazard and risk assessment from pyroclastic flows at Ischia island (southern Italy). Journal of volcanology and geothermal research, 171(1-2), 118-136.
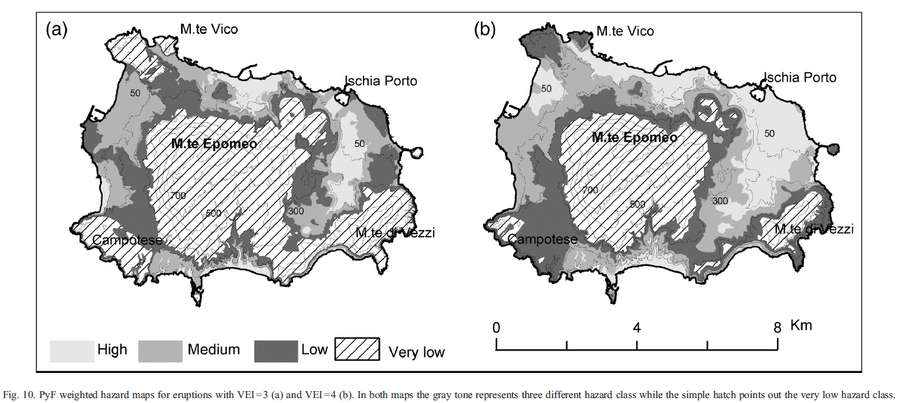
Figure in a journal article
PyF weighted hazard maps for eruptions with VEI=3 and VEI=4
Figure 10 in: Alberico, I., Lirer, L., Petrosino, P., & Scandone, R. (2008). Volcanic hazard and risk assessment from pyroclastic flows at Ischia island (southern Italy). Journal of volcanology and geothermal research, 171(1-2), 118-136.
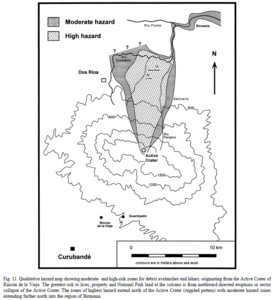
Figure in a journal article
Qualitative hazard map showing moderate- and high-risk zones for debris avalanches and lahars, originating from the Active Crater of Rincón de la Vieja
Figure 11 in: Kempter, K. A., & Rowe, G. L. (2000). Leakage of Active Crater lake brine through the north flank at Rincón de la Vieja volcano, northwest Costa Rica, and implications for crater collapse. Journal of Volcanology and Geothermal Research, 97(1-4), 143-159. https://doi.org/10.1016/S0377-0273(99)00181-X
Official, Figure in a journal article
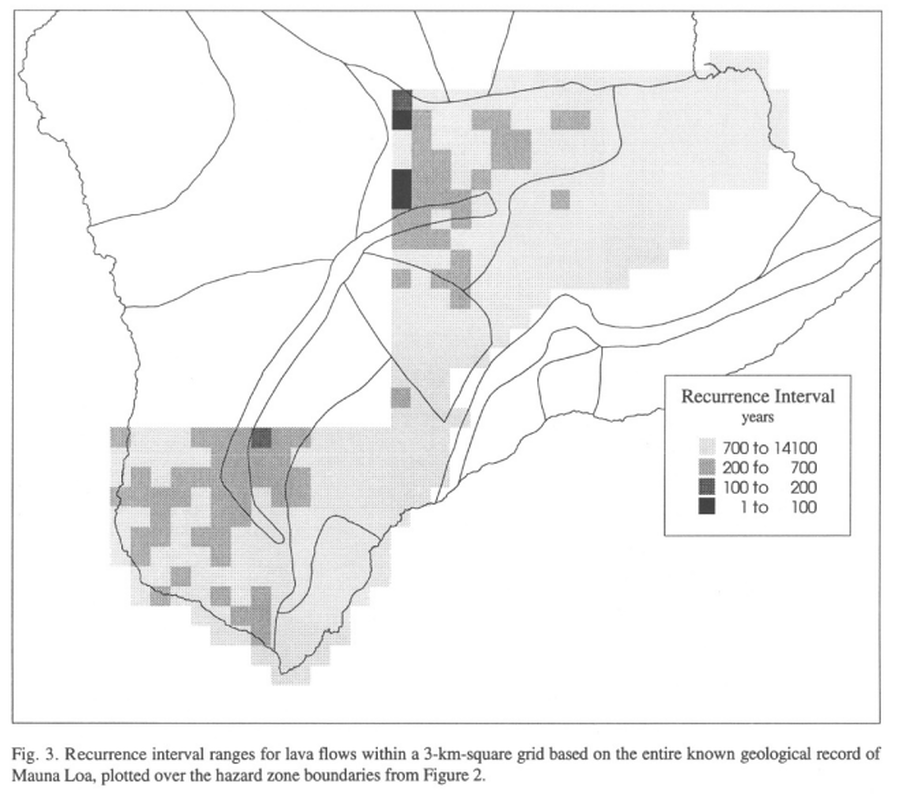
Recurrence interval ranges for lava flows within a 3-km-square grid based on the entire known geological record of Mauna Loa
Figure 3 in: Kauahikaua, J., Margriter, S., Lockwood, J., & Trusdell, F. (1995). Applications of GIS to the estimation of lava flow hazards on Mauna Loa Volcano, Hawai'i. Washington DC American Geophysical Union Geophysical Monograph Series, 92, 315-325. https://doi.org/10.1029/GM092p0315

Official, Figure in a journal article
Recurrence interval ranges for lava flows within a 3-km-square grid based on the geologic record of Mauna Loa from the last 150 years
Figure 4 in: Kauahikaua, J., Margriter, S., Lockwood, J., & Trusdell, F. (1995). Applications of GIS to the estimation of lava flow hazards on Mauna Loa Volcano, Hawai'i. Washington DC American Geophysical Union Geophysical Monograph Series, 92, 315-325. https://doi.org/10.1029/GM092p0315

Official, Figure in a journal article
Recurrence intervals for lava flows erupted between 1843 and the present within topographically-defined catchments
Figure 5 in: Kauahikaua, J., Margriter, S., Lockwood, J., & Trusdell, F. (1995). Applications of GIS to the estimation of lava flow hazards on Mauna Loa Volcano, Hawai'i. Washington DC American Geophysical Union Geophysical Monograph Series, 92, 315-325. https://doi.org/10.1029/GM092p0315
Official, Figure in hazard assessment
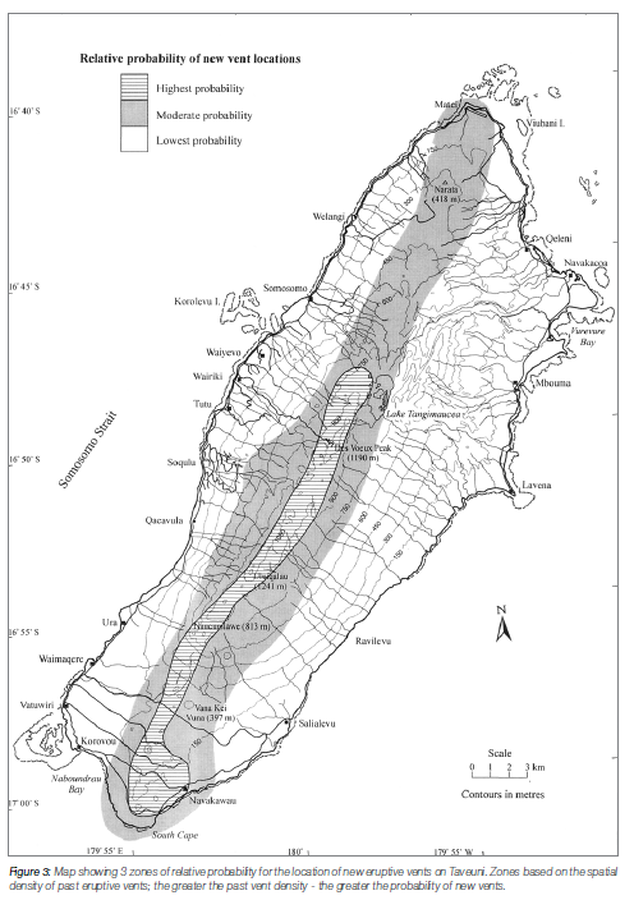
Relative probability of new vent locations
Figure 3 in: Cronin, S.J. (2016). Is There Volcanic Hazard In Fiji? Volcanic Geology Investigations On Taveuni. In: Taylor, P.W. (Ed.) Volcanic Hazards and Emergency Management in the Southwest Pacific, SPC Technical Bulletin, SPC00017, p. 170-178
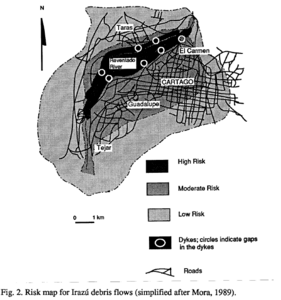
Figure in a thesis or dissertation
Risk map for Irazú debris flows (simplified after Mora, 1989)
Figure 2, Page 196 in: Alvarado I., G.E. (1993). Volcanology and Petrology of Irazú Volcano, Costa Rica. Christian-Albrechts-Universität, Kiel. PhD Dissertation. 288 p. (Simplified from: Mora 1993)
Official, Figure in a journal article
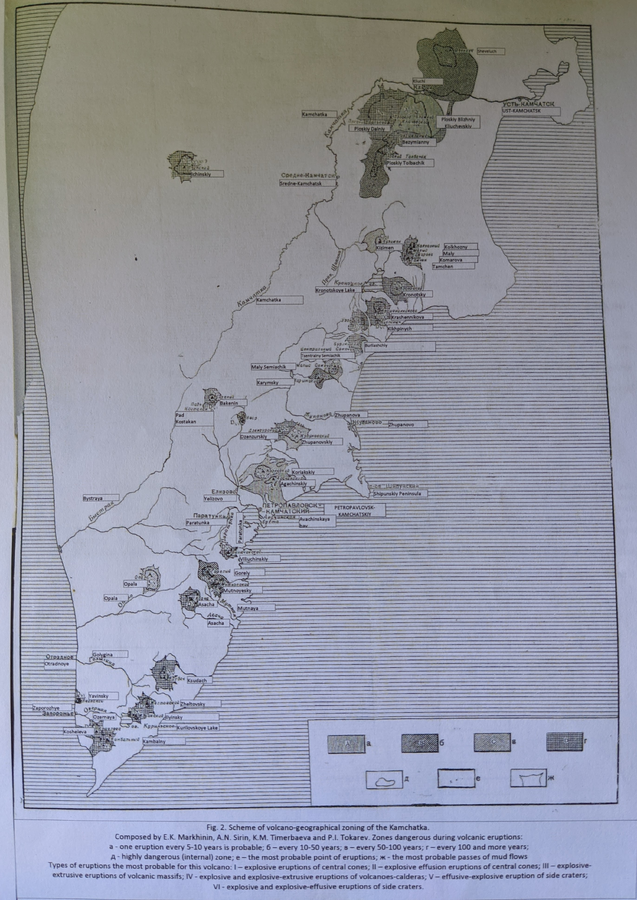
Scheme of volcano-geographical zoning in Kamchatka
Figure 2 in: Markhinin, E. K., Sirin, A. N., Timerbayeva, K. M., & Tokarev, P. I. (1962). Experience of volcanic-geographic zoning of Kamchatka and Kuril Islands. Bulletin of the Volcanological Station, Petropavlousk, Kamchatskiy, USSR, 32, 52-70.