
Advanced Search for Maps
Showing 51-60 of 349
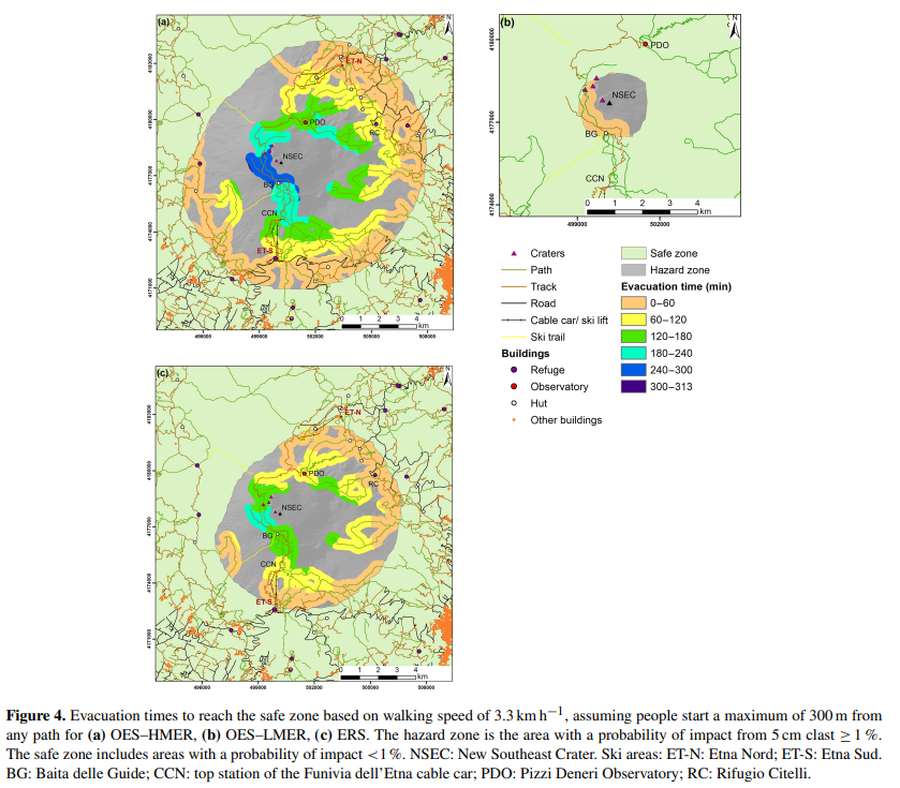
Figure in a journal article
Evacuation times to reach the safe zone based on walking speed of 3.3 km h^−1
Figure 4 in: Osman, S., Rossi, E., Bonadonna, C., Frischknecht, C., Andronico, D., Cioni, R., & Scollo, S. (2019). Exposure-based risk assessment and emergency management associated with the fallout of large clasts at Mount Etna. Natural Hazards and Earth System Sciences, 19(3), 589-610. https://doi.org/10.5194/nhess-19-589-2019
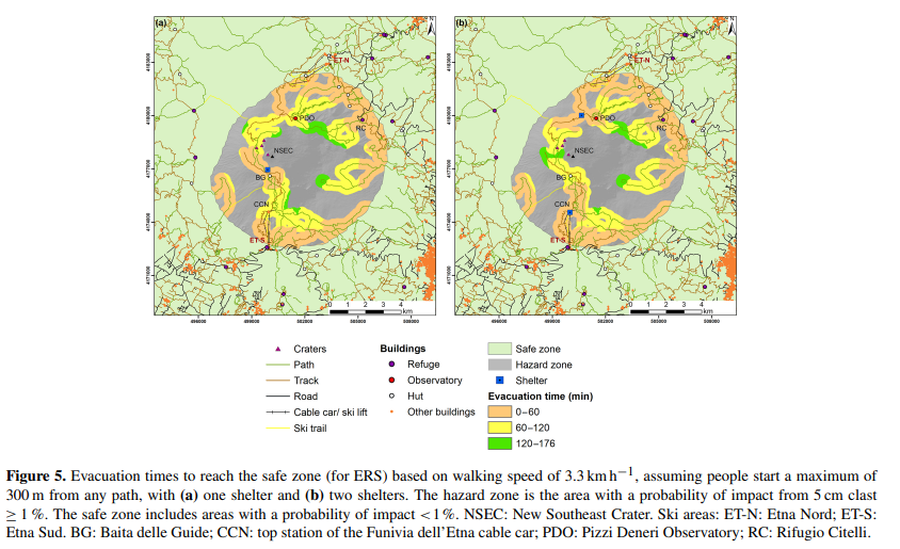
Figure in a journal article
Evacuation times to reach the safe zone based on walking speed of 3.3 km h^−1, assuming people start a maximum of 300 m from any path, with (a) one shelter and (b) two shelters
Figure 5 in: Osman, S., Rossi, E., Bonadonna, C., Frischknecht, C., Andronico, D., Cioni, R., & Scollo, S. (2019). Exposure-based risk assessment and emergency management associated with the fallout of large clasts at Mount Etna. Natural Hazards and Earth System Sciences, 19(3), 589-610. https://doi.org/10.5194/nhess-19-589-2019
Official, Map sheet or poster
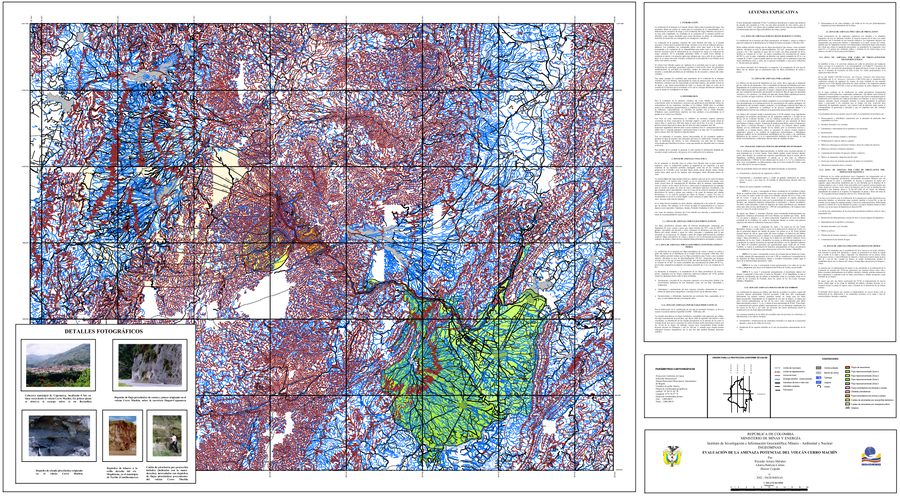
Evaluación de la Amenaza Potencial del Volcán Cerro Machín
(Assessment of Potential Hazards of Cerro Machín Volcano)
Méndez, R.A., Cortés, G.P., & Cepeda, H. (2002). Evaluación de la Amenaza Potencial del Volcán Cerro Machín. Instituto de Investigación e Información Geocientífica, Minero - Ambiental y Nuclear (INGEOMINAS). mapa escala 1:150,213. Bogotá with accompanying text: INGEOMINAS (Instituto de Investigación e Información Geocientífica, Minero, Ambiental Y Nuclear). (2003) Memoria explicativa del Mapa de Amenaza Volcánica del Cerro Machín. Bogotá.
Official, Figure in hazard assessment
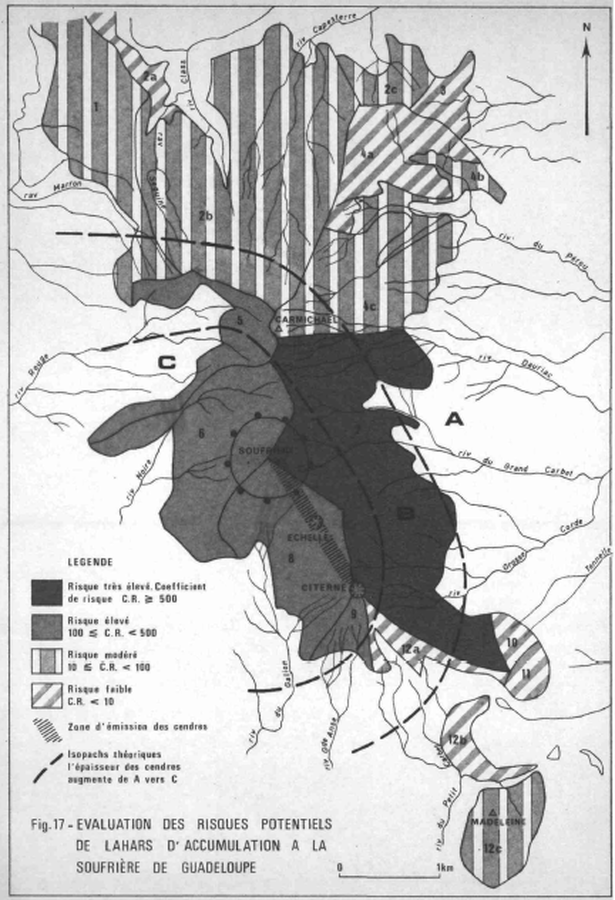
Evaluation des Risques Potentiels de Lahars d'Accumulation a la Soufrière de Guadeloupe
(Assessment of the Potential Risks of Lahars of Accumulation at the Soufriere of Guadeloupe)
Figure 17 in: Westercamp, D. (1977) Levés géologiques, évaluation et zonation des risques volcaniques à la Soufrière de Guadeloupe F. W. I. (Rapport de mission) Mai-Juin 1977. Délégation Générale a la Recherche Scientifique et Technique. 77 Ant 29
Official, Figure in hazard assessment
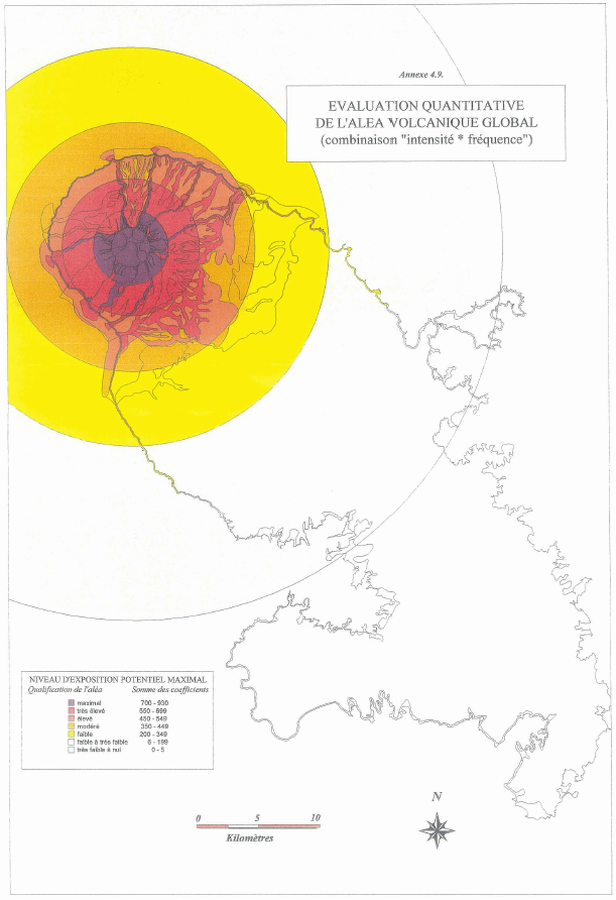
Evaluation Quantitative De L'Aléa Volcanique Global (combinaison "intensite * fréquence)
(Quantitative Assessment of the Global Volcanic Hazard (combination "intensity * frequency))
Annex 4.9 in: Stieltjes, L. & Mirgon, C. (1998). Approche méthodologique de la vulnérabilité aux phénomènes volcaniques. Test d’application sur les réseaux de la Martinique. Rapport de synthese. Rapport Bureau de Recherches Géologiques et Minières (BRGM), Marseille, R 40098. http://infoterre.brgm.fr/rapports/RR-40098-FR.pdf
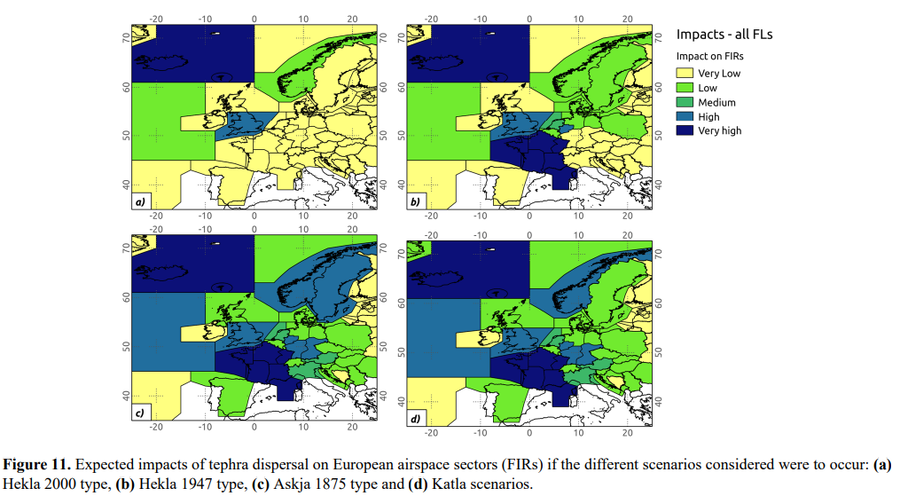
Figure in a journal article
Expected impacts of tephra dispersal on European airspace sectors
Figure 11 in: Scaini, C., Biass, S., Galderisi, A., Bonadonna, C., Folch, A., Smith, K., & Höskuldsson, A. (2014). A multi-scale risk assessment for tephra fallout and airborne concentration from multiple Icelandic volcanoes–Part 2: Vulnerability and impact. Natural hazards and earth system sciences, 14(8), 2289–2312. https://doi.org/10.5194/nhess-14-2289-2014
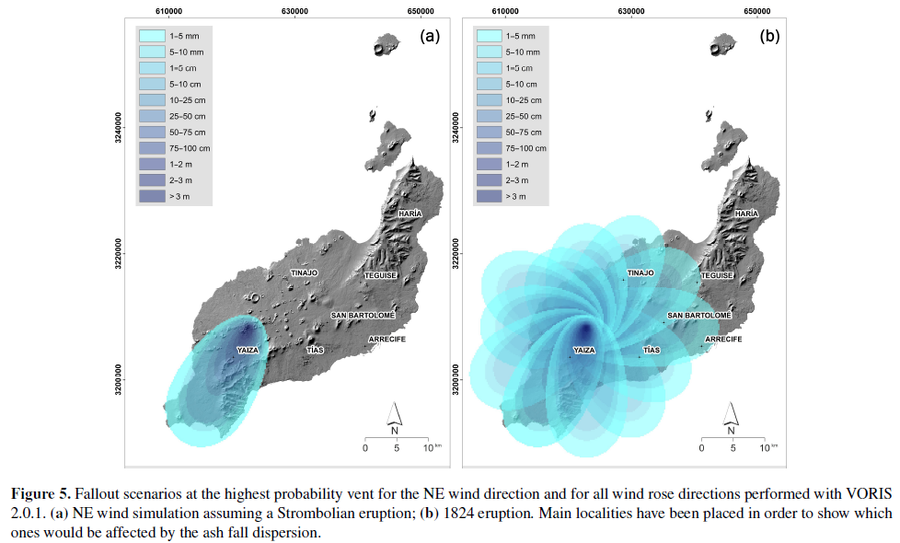
Figure in a journal article
Fallout scenarios at the highest probability vent for the NE wind direction and for all wind rose directions performed with VORIS 2.0.1
Figure 5 in: Becerril, L., Martí, J., Bartolini, S., & Geyer, A. (2017). Assessing qualitative long-term volcanic hazards at Lanzarote Island (Canary Islands). Natural Hazards and Earth System Sciences, 17(7), 1145-1157. https://doi.org/10.5194/nhess-17-1145-2017
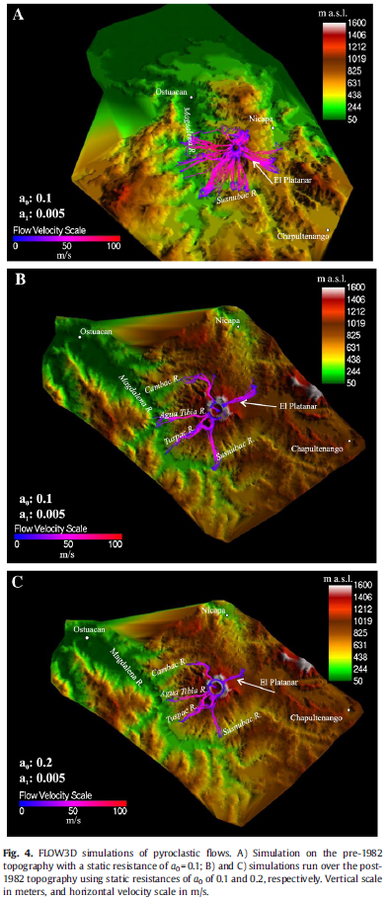
Figure in a journal article
FLOW3D simulations of pyroclastic flows
Figure 4 in: Macías, J. L., Capra, L., Arce, J. L., Espíndola, J. M., García-Palomo, A., & Sheridan, M. F. (2008). Hazard map of El Chichón volcano, Chiapas, México: Constraints posed by eruptive history and computer simulations. Journal of Volcanology and Geothermal Research, 175(4), 444-458. https://doi.org/10.1016/j.jvolgeores.2008.02.023
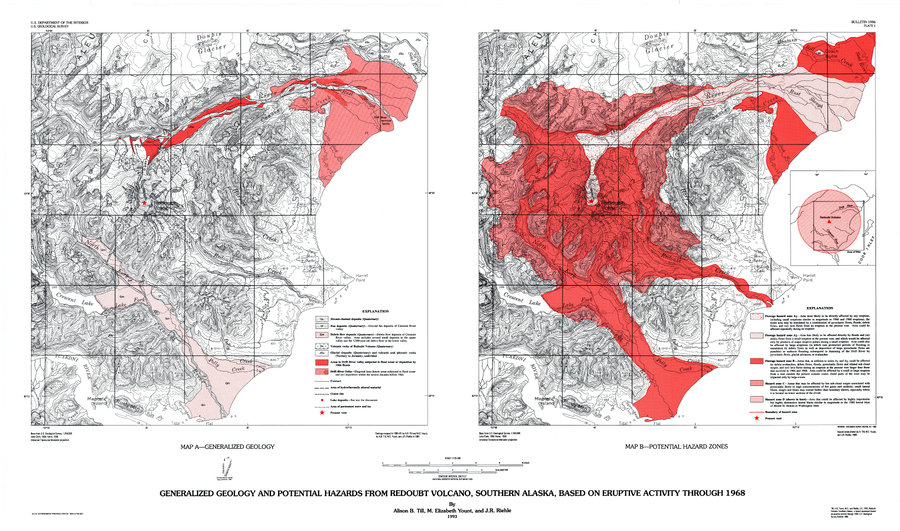
Official, Insert/poster-size map with accompanying report
Generalized Geology and Potential Hazards from Redoubt Volcano, Southern Alaska, Based on Eruptive Activity Through 1968
Plate 1 in: Till, A.B., Yount, M.E., & Riehle, J.R. (1993). Redoubt Volcano, southern Alaska; a hazard assessment based on eruptive activity through 1968. U.S. Geological Survey, Bulletin 1996, 19 p., 1 plate. https://doi.org/10.3133/b1996
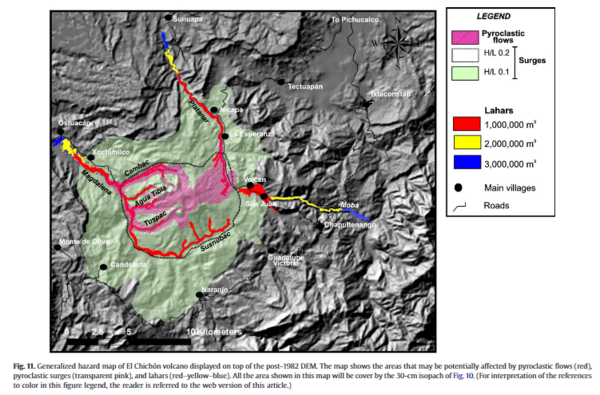
Figure in a journal article
Generalized hazard map of El Chichón volcano displayed on top of the post-1982 DEM
Figure 11 in: Macías, J. L., Capra, L., Arce, J. L., Espíndola, J. M., García-Palomo, A., & Sheridan, M. F. (2008). Hazard map of El Chichón volcano, Chiapas, México: Constraints posed by eruptive history and computer simulations. Journal of Volcanology and Geothermal Research, 175(4), 444-458. https://doi.org/10.1016/j.jvolgeores.2008.02.023