
Advanced Search for Maps
Showing 611-620 of 2217
Official, Figure in a journal article
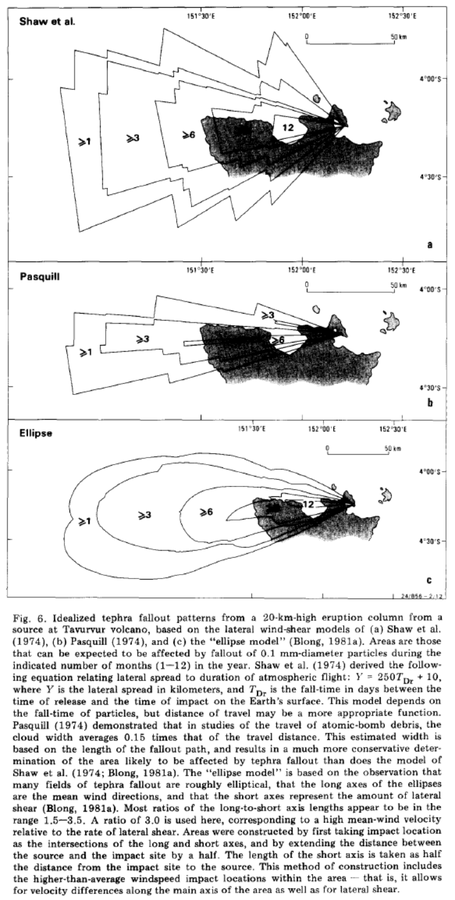
Idealized tephra fallout patterns from a 20-km-high eruption column from a source at Tavurvur volcano
Figure 6 in: McKee, C. O., Johnson, R. W., Lowenstein, P. L., Riley, S. J., Blong, R. J., De Saint Ours, P., & Talai, B. (1985). Rabaul caldera, Papua New Guinea: volcanic hazards, surveillance, and eruption contingency planning. Journal of Volcanology and Geothermal Research, 23(3-4), p. 195-237. https://doi.org/10.1016/0377-0273(85)90035-6
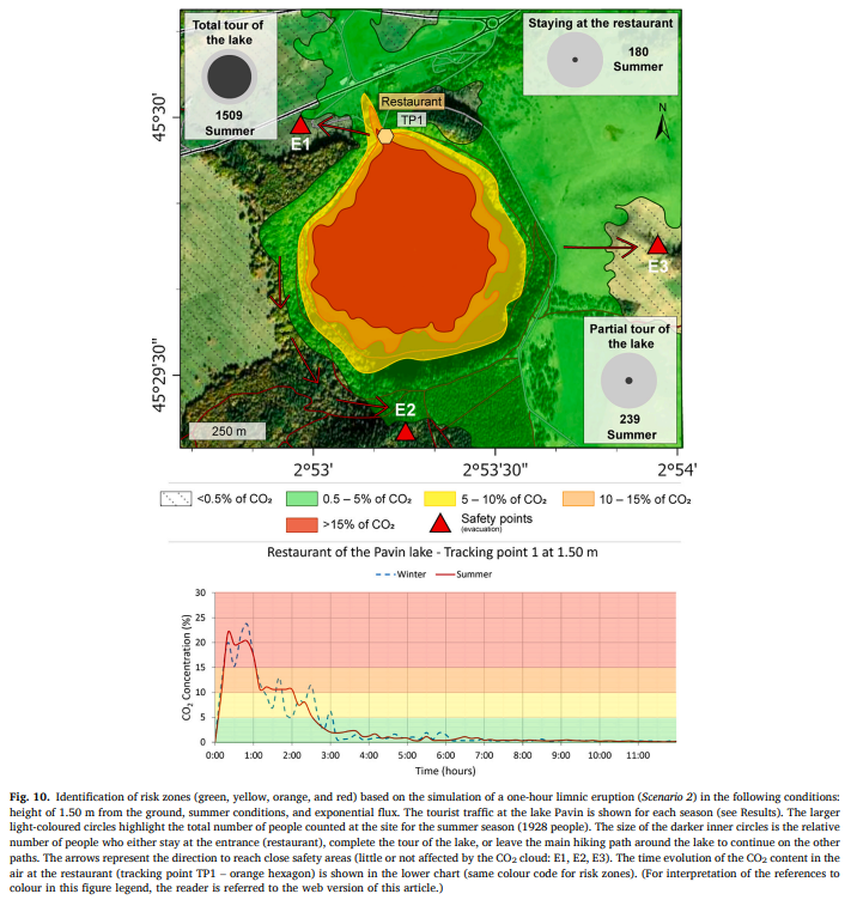
Figure in a journal article
Identification of risk zones (green, yellow, orange, and red) based on the simulation of a one-hour limnic eruption (Scenario 2)
Figure 10 in: Rafflin, V., Boudoire, G., Massaro, S., Stocchi, M., Costa, A., Grassa, F., Giuffrida, G., Gailler, L., Planche, C., Banson, S., & Harris, A. (2024). Modelling CO2 dispersion in the air during potential limnic eruption at the lake Pavin (France). Journal of Volcanology and Geothermal Research, 108024. https://doi.org/10.1016/j.jvolgeores.2024.108024
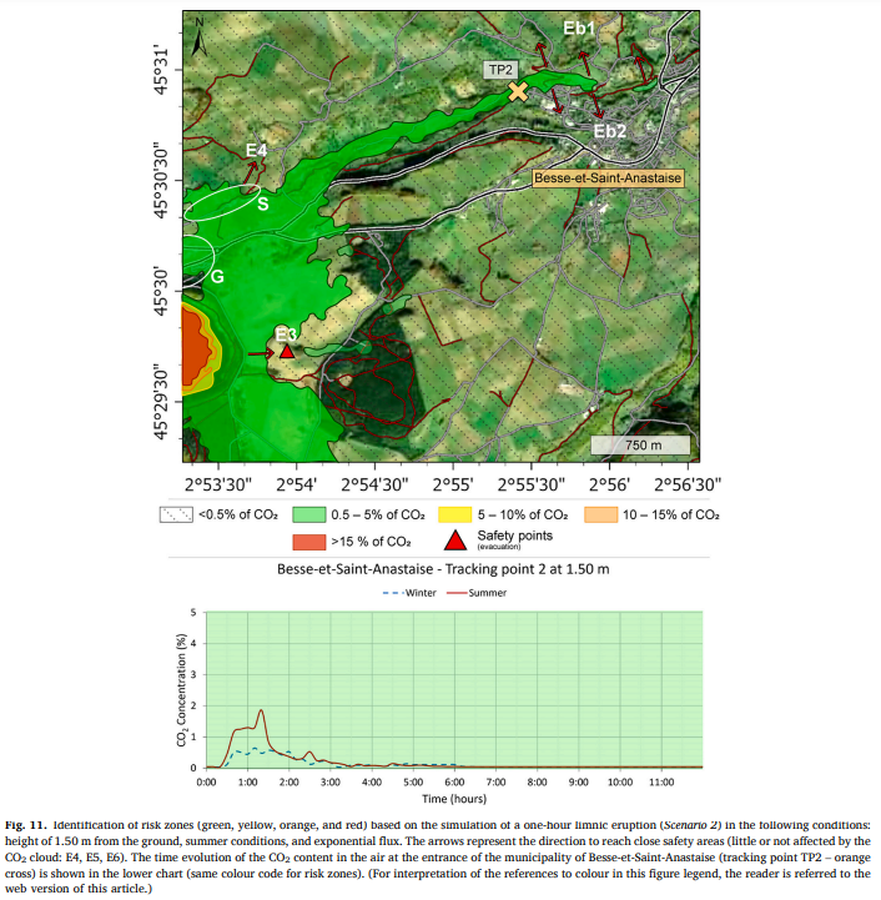
Figure in a journal article
Identification of risk zones (green, yellow, orange, and red) based on the simulation of a one-hour limnic eruption (Scenario 2)
Figure 11 in: Rafflin, V., Boudoire, G., Massaro, S., Stocchi, M., Costa, A., Grassa, F., Giuffrida, G., Gailler, L., Planche, C., Banson, S., & Harris, A. (2024). Modelling CO2 dispersion in the air during potential limnic eruption at the lake Pavin (France). Journal of Volcanology and Geothermal Research, 108024. https://doi.org/10.1016/j.jvolgeores.2024.108024

Figure in a journal article
Illustrative example of a three-color hazard map of Tungurahua volcano, constructed by considering the 50% isoprobability curve of the maximum probabilistic hazard map of each scenario
Figure 10 in: Aravena, A., Tadini, A., Bevilacqua, A. et al. Probabilistic, scenario-based hazard assessment for pyroclastic density currents at Tungurahua volcano, Ecuador. (2024). Bulletin of Volcanology 86, 84. https://doi.org/10.1007/s00445-024-01768-y
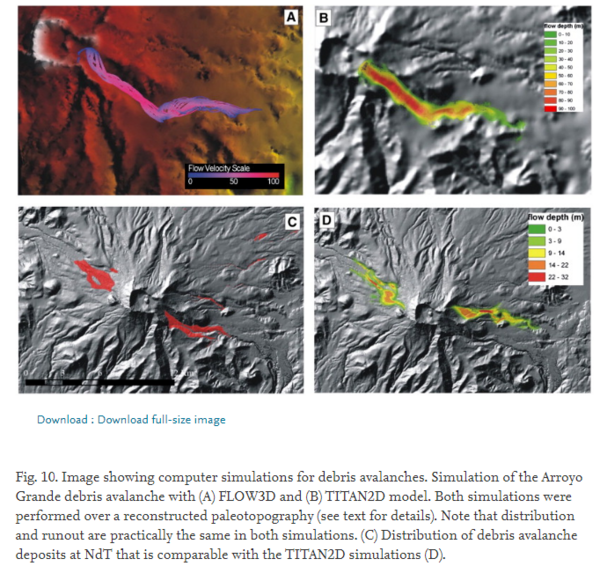
Figure in a journal article
Image showing computer simulations for debris avalanches
Figure 10 in: Capra, L., Norini, G., Groppelli, G., Macías, J.L., & Arce, J.L. (2008). Volcanic hazard zonation of the Nevado de Toluca volcano, México. Journal of Volcanology and Geothermal Research, 176(4), p. 469-484. https://doi.org/10.1016/j.jvolgeores.2008.04.016
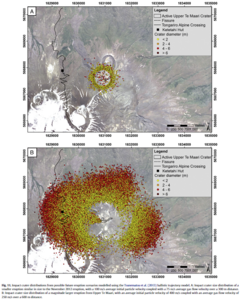
Figure in a journal article
Impact crater distributions from possible future eruption scenarios modelled using the Tsunematsu et al. (2013) ballistic trajectory model
Figure 11 in: Fitzgerald, R. H., Tsunematsu, K., Kennedy, B. M., Breard, E. C. P., Lube, G., Wilson, T. M., Jolly, A.D., Pawson, J., Rosenburg, M.D., & Cronin, S. J. (2014). The application of a calibrated 3D ballistic trajectory model to ballistic hazard assessments at Upper Te Maari, Tongariro. Journal of volcanology and geothermal research, 286, p. 248-262. https://doi.org/10.1016/j.jvolgeores.2014.04.006
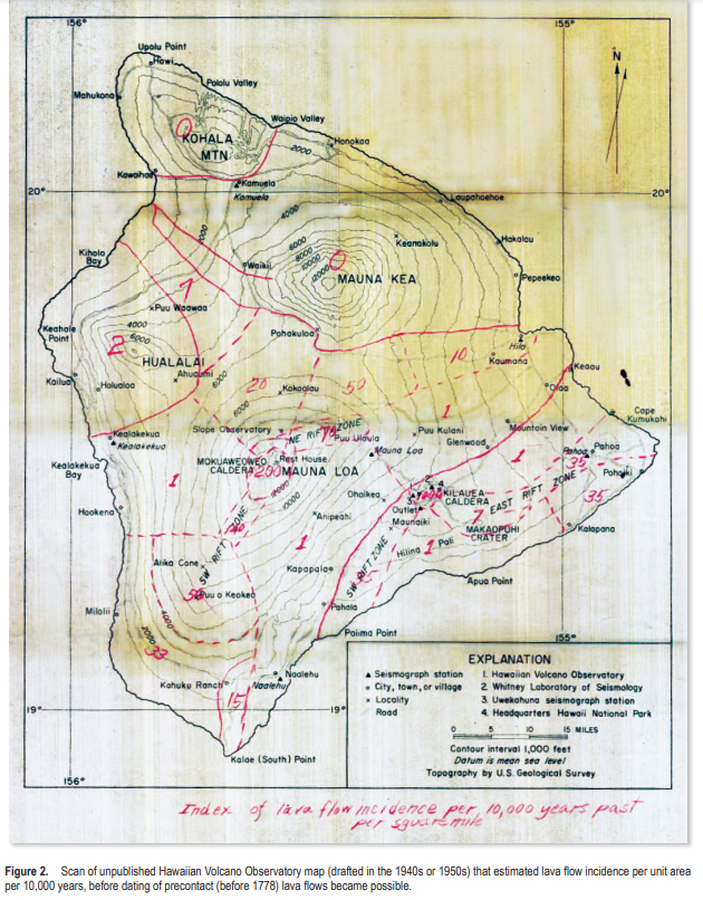
Official, Unknown format
Index of lava flow incidence per 10,000 years past per square mile
Figure 2 (in reprint) in: Hawaiian Volcano Observatory. (1940s or 1950s). Index of lava flow incidence per 10,000 years past per square mile. (Reprinted in: Kauahikaua, J.P. & Tilling, R.I. (2014). Natural hazards and risk reduction in Hawai‘i. In: Poland, M.P., Takahashi, T.J., & Landowski, C.M. (eds.) Characteristics of Hawaiian Volcanoes. US Geological Survey Professional Paper 1801, p. 397-427. https://doi.org/10.3133/pp180110)
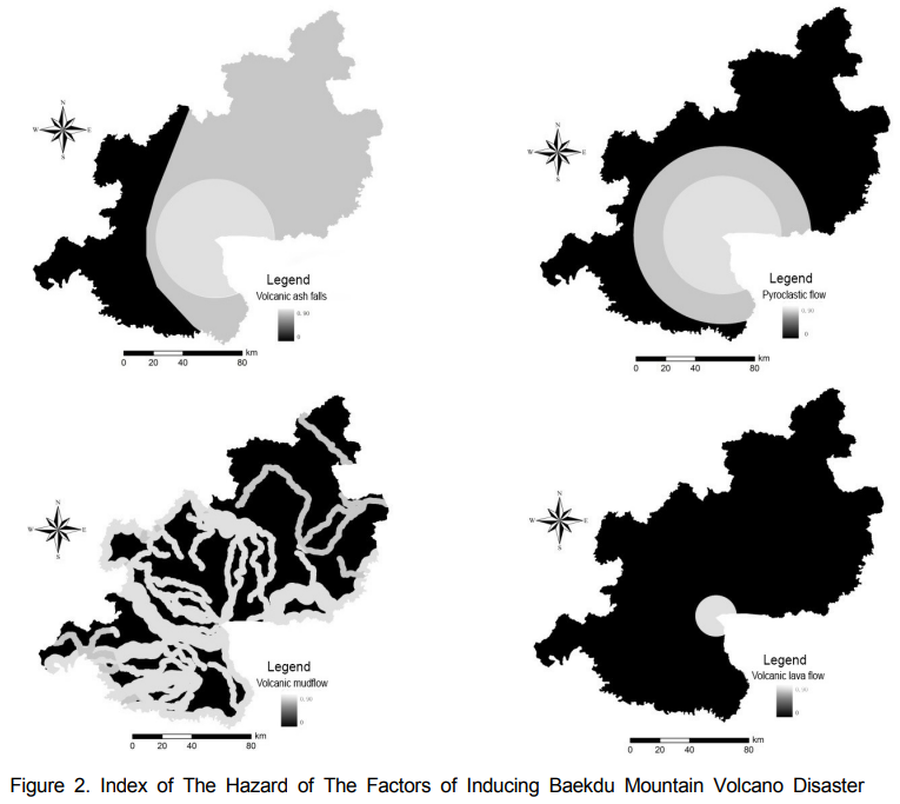
Figure in a journal article
Index of The Hazard of The Factors of Inducing Baekdu Mountain Volcano Disaster
Figure 2 in: Xiao-Jiao, N., Choi, Y. S., & Ying, N. (2014). A Study on Integrated Assessment of Baekdu Mountain Volcanic Aisaster risk Based on GIS. Journal of Korea Spatial Information Society. Korea Spatial Information Society. https://doi.org/10.12672/ksis.2014.22.4.077
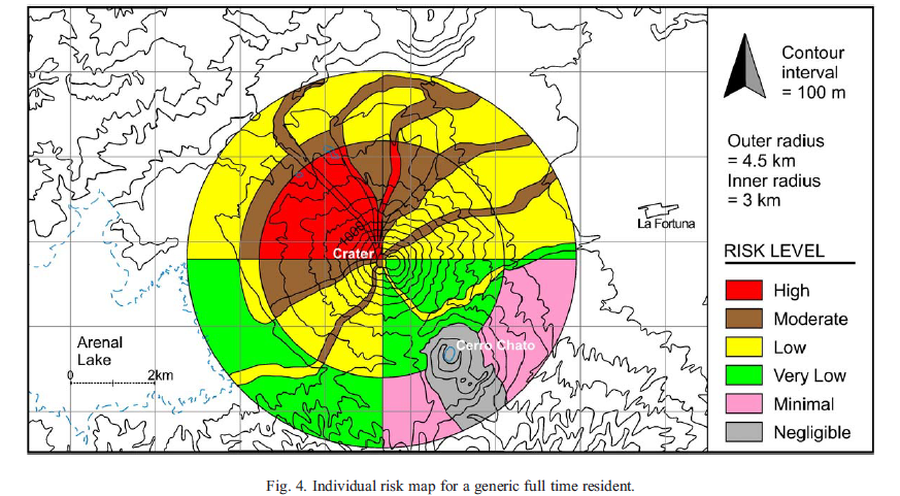
Figure in a journal article
Individual risk map for a generic full time resident
Figure 4 in: Meloy, A.F. (2006). Arenal-type pyroclastic flows: a probabilistic event tree risk analysis. Journal of Volcanology and Geothermal Research, 157(1-3), 121-134. https://doi.org/10.1016/j.jvolgeores.2006.03.048
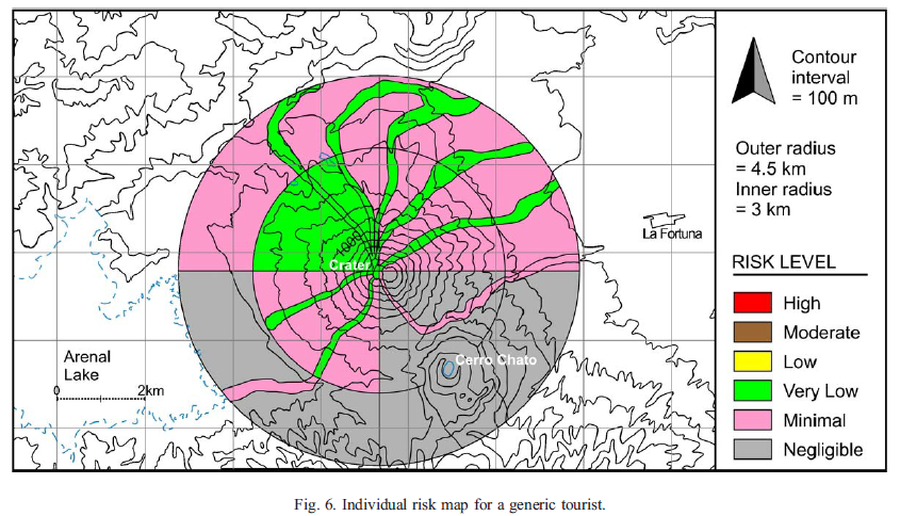
Figure in a journal article
Individual risk map for a generic tourist
Figure 6 in: Meloy, A. F. (2006). Arenal-type pyroclastic flows: a probabilistic event tree risk analysis. Journal of Volcanology and Geothermal Research, 157(1-3), 121-134. https://doi.org/10.1016/j.jvolgeores.2006.03.048